High Protein Fish and Seafood: Grams per Serving
Cooked fish and shellfish give 19 to 29 g of protein per 100 g (3.5 oz). Yellowfin tuna leads at 29.2 g, sockeye salmon has 26.5 g and shrimp 24.0 g.
Key takeaways
- Cooked fish and shellfish give 19–29 g of protein per 100 g in USDA records, led by yellowfin tuna (29.2 g), sockeye salmon (26.5 g) and shrimp (24.0 g).
- A cooked 3 oz (85 g) serving of the 16 foods in the table gives 16–25 g of protein.
- Per calorie, shrimp leads with 24.2 g of protein per 100 kcal, and Atlantic mackerel gives 9.1 g.
- Half a fillet of sockeye (155 g) has 41.0 g of protein and 242 kcal, and half a fillet of farmed Atlantic salmon (178 g) has 39.3 g and 367 kcal.
- Raw shrimp records read 13.6–20.1 g of protein per 100 g against 24.0 g cooked, so log the state you weighed.
High protein fish and shellfish give 19 to 29 g of protein for every 100 g (3.5 oz) you cook. Yellowfin tuna tops my table at 29.2 g, sockeye salmon follows at 26.5 g and shrimp comes in at 24.0 g. Each figure comes from a USDA FoodData Central record that I read first.
A standard serving, 3 oz (85 g) cooked, lands between 16 and 25 g of protein. Which species you pick changes that less than the calories do, or than whether the fish was weighed raw or cooked.
Which high protein fish has the most protein per serving?
Snapper and tilapia sit right behind yellowfin and sockeye, so four fish land at 26 to 29 g per 100 g cooked. The table lists 16 fish and shellfish in the state each USDA record describes, sorted by protein in an 85 g (3 oz) serving. I picked 85 g because most of these records list 3 oz as a portion.
| Fish or seafood (state) | Protein per 100 g | Energy per 100 g | Protein in 85 g (3 oz) | Energy in 85 g (3 oz) |
|---|---|---|---|---|
| Tuna, yellowfin, cooked, dry heat | 29.2 g | 130 kcal | 24.8 g | 111 kcal |
| Salmon, sockeye, cooked, dry heat | 26.5 g | 156 kcal | 22.5 g | 133 kcal |
| Snapper, cooked, dry heat | 26.3 g | 128 kcal | 22.4 g | 109 kcal |
| Tilapia, cooked, dry heat | 26.2 g | 128 kcal | 22.2 g | 109 kcal |
| Sardines, Atlantic, canned in oil, drained, with bone | 24.6 g | 208 kcal | 20.9 g | 177 kcal |
| Shrimp, cooked | 24.0 g | 99 kcal | 20.4 g | 84 kcal |
| Mackerel, Atlantic, cooked, dry heat | 23.9 g | 262 kcal | 20.3 g | 223 kcal |
| Trout, rainbow, farmed, cooked, dry heat | 23.8 g | 168 kcal | 20.2 g | 143 kcal |
| Mussels, blue, cooked, moist heat | 23.8 g | 172 kcal | 20.2 g | 146 kcal |
| Cod, Atlantic, cooked, dry heat | 22.8 g | 105 kcal | 19.4 g | 89 kcal |
| Halibut, cooked, dry heat | 22.5 g | 111 kcal | 19.2 g | 94 kcal |
| Salmon, Atlantic, farmed, cooked, dry heat | 22.1 g | 206 kcal | 18.8 g | 175 kcal |
| Scallops, steamed | 20.5 g | 111 kcal | 17.5 g | 94 kcal |
| Pollock, Alaska, cooked | 19.4 g | 87 kcal | 16.5 g | 74 kcal |
| Crab, Alaska king, cooked, moist heat | 19.4 g | 97 kcal | 16.4 g | 82 kcal |
| Tuna, light, canned in water, drained | 19.0 g | 90 kcal | 16.2 g | 77 kcal |
Among the top few the differences are tiny. Sockeye, snapper and tilapia sit within 0.4 g of each other per 100 g, so choose among them by taste and price. The gaps open further down: canned light tuna, crab and pollock give about 16 g per serving, a third less than yellowfin. A can of light tuna (107 g drained) gives 20.3 g of protein for 96 kcal.
Energy is the other half. An 85 g serving of Atlantic mackerel carries 223 kcal. The same weight of cod carries 89 kcal. Both give 19 to 20 g of protein. Weigh fish after cooking and read the state in the record name, because a raw fillet and a cooked one are different rows.
The gap can be big. Raw Atlantic cod has 16.1 g of protein per 100 g, and cooked cod has 22.8 g. Log 100 g of raw cod as cooked and you add 6.8 g of protein you never ate. That’s 42% more than the raw record says. These are two different samples, so the gap shows how big the trap is. It doesn’t measure a cooking yield.
Which high protein fish gives the most protein per calorie?
Shrimp does, with 24.2 g of protein for every 100 kcal. I got that by dividing the protein by the energy in each USDA record. Yellowfin tuna and pollock follow at 22.4 g, haddock at 22.2 g and cod at 21.7 g.
| Fish or seafood (state) | Protein per 100 kcal | Fat per 100 g |
|---|---|---|
| Shrimp, cooked | 24.2 g | 0.3 g |
| Tuna, yellowfin, cooked, dry heat | 22.4 g | 0.6 g |
| Pollock, Alaska, cooked | 22.4 g | 1.0 g |
| Haddock, cooked, dry heat | 22.2 g | 0.6 g |
| Cod, Atlantic, cooked, dry heat | 21.7 g | 0.9 g |
| Salmon, sockeye, cooked, dry heat | 17.0 g | 5.6 g |
| Salmon, Atlantic, farmed, cooked, dry heat | 10.7 g | 12.4 g |
| Mackerel, Atlantic, cooked, dry heat | 9.1 g | 17.8 g |
Oily fish sit at the bottom. Mackerel gives 9.1 g of protein per 100 kcal and farmed Atlantic salmon 10.7 g. They carry 17.8 g and 12.4 g of fat per 100 g. If you eat to a calorie budget, I would use lean fish most days and keep an oily serving for one meal a week.
How much protein does salmon have?
Half a fillet of cooked sockeye salmon (155 g) has 41.0 g of protein and 242 kcal, using the sockeye record. Farmed Atlantic salmon is close on protein per fillet and far apart on energy.
| Salmon record (state) | Portion in the record | Protein | Energy |
|---|---|---|---|
| Salmon, sockeye, cooked, dry heat | half a fillet, 155 g | 41.0 g | 242 kcal |
| Salmon, Atlantic, farmed, cooked, dry heat | half a fillet, 178 g | 39.3 g | 367 kcal |
| Salmon, coho, farmed, cooked, dry heat | one fillet, 143 g | 34.7 g | 255 kcal |
| Salmon, pink, canned, drained | 3 oz, 85 g | 19.6 g | 117 kcal |
| Salmon, chinook, smoked | 3 oz, 85 g | 15.5 g | 99 kcal |
Compare the first two rows. The Atlantic half fillet weighs 23 g more, yet it has only 1.7 g more protein and 125 kcal more energy. Fat explains most of that: 5.6 g per 100 g in the sockeye record against 12.4 g in the farmed Atlantic one. Both are fine fish. Which one you log changes your calorie total, so pick the record that matches the label on your fillet.
Canned pink salmon is the pantry route: 3 oz drained gives 19.6 g of protein for 117 kcal. Smoked chinook gives 15.5 g in the same 3 oz, and its record lists 672 mg of sodium per 100 g. Check the label.
How much protein does shrimp have?
Cooked shrimp has 24.0 g of protein per 100 g. An 85 g (3 oz) serving gives 20.4 g for 84 kcal, per the USDA record for cooked shrimp. Raw numbers are lower. They don’t agree with each other either.
| Shrimp record | Protein per 100 g | Energy per 100 g |
|---|---|---|
| Shrimp, cooked | 24.0 g | 99 kcal |
| Shrimp, raw | 20.1 g | 85 kcal |
| Shrimp, farm raised, raw | 15.6 g | 76 kcal |
| Shrimp, mixed species, raw (may contain additives to retain moisture) | 13.6 g | 71 kcal |
Three raw records give three answers: 13.6, 15.6 and 20.1 g per 100 g. Cooked shrimp reads higher. Cooking drives out water. The last record is for shrimp that may contain additives to retain moisture, and it has the lowest protein of the four.
My rule: log shrimp the way it sits on the scale. A bag marked raw gets a raw record. A plate of cooked shrimp gets the cooked one. Mix them up and you’re off by 4 to 10 g of protein per 100 g. Not small.
How much fish can I fit into a week?
The FDA and EPA fish advice cites the Dietary Guidelines as recommending at least 8 oz (227 g) of seafood a week on a 2,000 kcal diet. At 26.5 g per 100 g that is about 60 g of protein a week from sockeye, or 8.6 g a day. Fish helps, but it fills a slice of the day, and how much protein you should eat a day has the whole sum. Two servings a week won’t carry it, so the other meals matter: high protein cereal covers a breakfast bowl and high protein mac and cheese a pasta night. If you want fish to do more of the work, eat it more often and check the mercury lists below.
That page also sorts fish by mercury. Most of my table sits under Best Choices, including salmon, shrimp, cod, sardines and canned light tuna. Halibut, snapper and yellowfin tuna are under Good Choices. King mackerel, marlin, orange roughy, shark, swordfish and bigeye tuna are under Choices to Avoid. The advice is written for people who are pregnant or breastfeeding and for children. If that’s you, follow its amounts: 8 to 12 oz a week, or 2 to 3 servings of 4 oz from the Best Choices.
The protein calculator shows how many servings of fish your own target needs. It uses the 1.2 to 1.6 g per kg range of the 2025–2030 Dietary Guidelines, with a floor of 60 g.
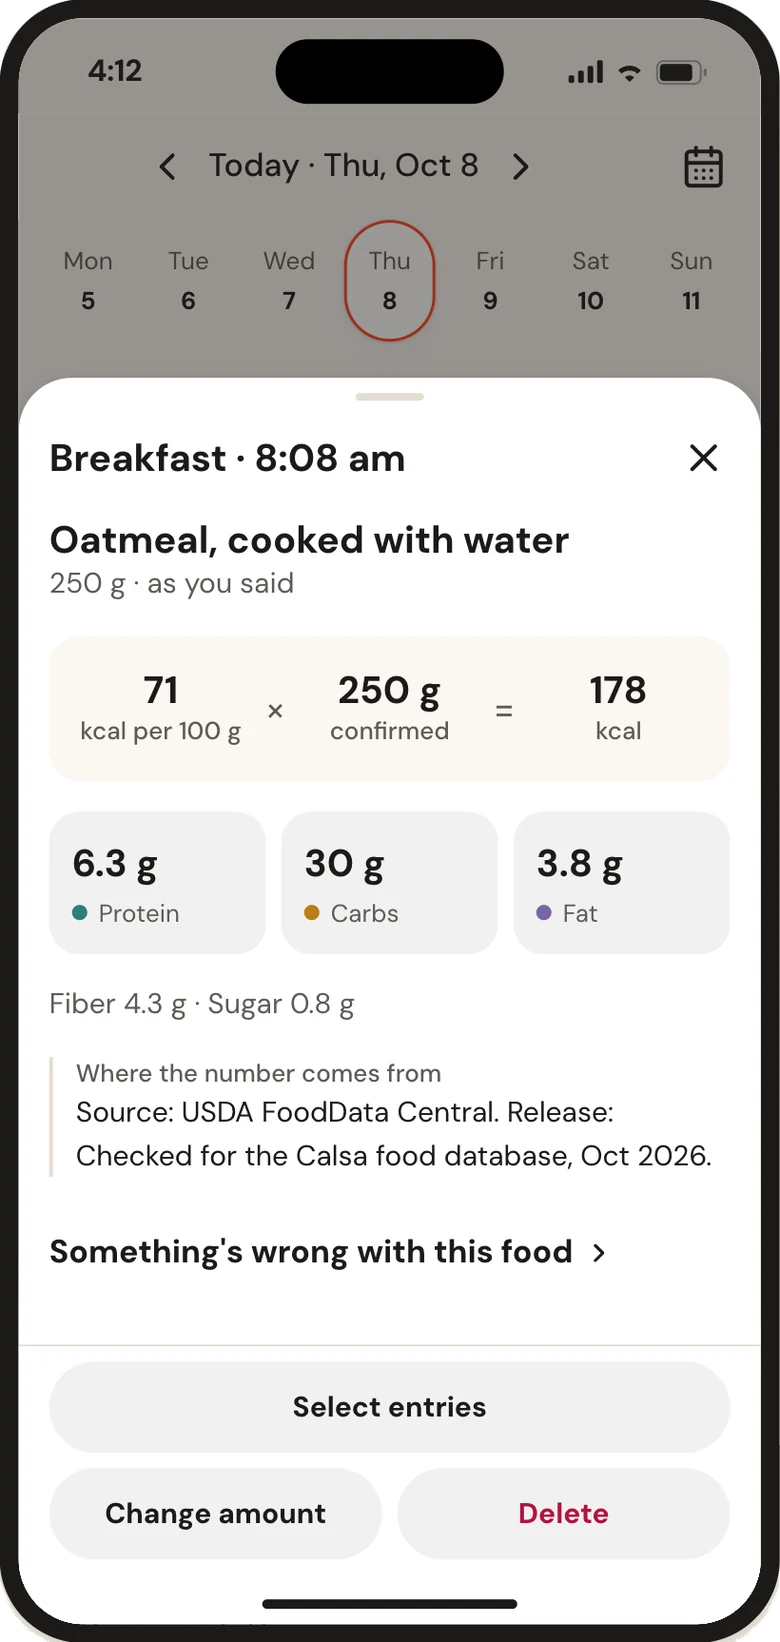
Weigh fish cooked and match the state in the table. I log it in Calsa, where each entry shows its “per 100 g × grams” math, so a raw record picked for a cooked fillet shows at a glance.
Questions and answers
Is tuna high in protein?
Yes. Light tuna in water has 19.0 g of protein per 100 g drained, and one can's drained solids (107 g) hold 20.3 g of protein and 96 kcal. Canned light tuna is also on the FDA's Best Choices list for mercury.
Does smoked salmon have as much protein as cooked salmon?
It has less per 100 g. Smoked chinook salmon has 18.3 g of protein per 100 g, against 26.5 g for cooked sockeye. A 3 oz (85 g) serving gives 15.5 g, and the record lists 672 mg of sodium per 100 g, so check the label on yours.
Which fish has the least protein?
Among the 16 in the table, canned light tuna is lowest at 19.0 g per 100 g, with Alaska king crab and pollock at 19.4 g. Smoked chinook salmon is lower still at 18.3 g. Raw records read lower because they hold more water: raw cod has 16.1 g and raw shrimp 13.6–20.1 g per 100 g.
Is fish a good source of protein?
Yes. High protein fish and shellfish give 19 to 29 g of protein per 100 g (3.5 oz) cooked, and a standard 3 oz (85 g) serving lands between 16 and 25 g. Yellowfin tuna tops my table at 29.2 g per 100 g and sockeye salmon follows at 26.5 g. Weigh fish cooked, because raw cod has 16.1 g per 100 g against 22.8 g for cooked cod.
Sources
- Fish, tuna, yellowfin, fresh, cooked, dry heat (SR Legacy, FDC ID 172006), USDA FoodData Central
- Fish, tilapia, cooked, dry heat (SR Legacy, FDC ID 175177), USDA FoodData Central
- Fish, salmon, sockeye, cooked, dry heat (SR Legacy, FDC ID 173692), USDA FoodData Central
- Fish, snapper, mixed species, cooked, dry heat (SR Legacy, FDC ID 173699), USDA FoodData Central
- Fish, sardine, Atlantic, canned in oil, drained solids with bone (SR Legacy, FDC ID 175139), USDA FoodData Central
- Crustaceans, shrimp, cooked (SR Legacy, FDC ID 175180), USDA FoodData Central
- Fish, mackerel, Atlantic, cooked, dry heat (SR Legacy, FDC ID 175120), USDA FoodData Central
- Fish, trout, rainbow, farmed, cooked, dry heat (SR Legacy, FDC ID 173718), USDA FoodData Central
- Mollusks, mussel, blue, cooked, moist heat (SR Legacy, FDC ID 174217), USDA FoodData Central
- Fish, cod, Atlantic, cooked, dry heat (SR Legacy, FDC ID 171956), USDA FoodData Central
- Fish, halibut, Atlantic and Pacific, cooked, dry heat (SR Legacy, FDC ID 174201), USDA FoodData Central
- Fish, salmon, Atlantic, farmed, cooked, dry heat (SR Legacy, FDC ID 175168), USDA FoodData Central
- Mollusks, scallop, (bay and sea), cooked, steamed (SR Legacy, FDC ID 167742), USDA FoodData Central
- Fish, pollock, Alaska, cooked (SR Legacy, FDC ID 173726), USDA FoodData Central
- Crustaceans, crab, alaska king, cooked, moist heat (SR Legacy, FDC ID 174202), USDA FoodData Central
- Fish, tuna, light, canned in water, drained solids (Foundation, FDC ID 334194), USDA FoodData Central
- Fish, cod, Atlantic, wild caught, raw (Foundation, FDC ID 2684444), USDA FoodData Central
- Fish, haddock, cooked, dry heat (SR Legacy, FDC ID 174198), USDA FoodData Central
- Fish, salmon, coho, farmed, cooked, dry heat (SR Legacy, FDC ID 173716), USDA FoodData Central
- Fish, salmon, pink, canned, drained solids (SR Legacy, FDC ID 175175), USDA FoodData Central
- Fish, salmon, chinook, smoked (SR Legacy, FDC ID 173687), USDA FoodData Central
- Crustaceans, shrimp, raw (SR Legacy, FDC ID 175179), USDA FoodData Central
- Crustaceans, shrimp, farm raised, raw (Foundation, FDC ID 2684443), USDA FoodData Central
- Crustaceans, shrimp, mixed species, raw (may contain additives to retain moisture) (SR Legacy, FDC ID 174210), USDA FoodData Central
- Advice About Eating Fish (content current as of 5 March 2024; advice revised October 2021), U.S. Food and Drug Administration and U.S. Environmental Protection Agency