Macro Counting Apps: What Actually Matters
A macro counting app should take calories from the same food record as its grams. Protein, fat and carbs at 4, 9 and 4 kcal per gram differ from the record by up to 11%.
Key takeaways
- Protein, fat and carbs at 4, 9 and 4 kcal per gram differ from the energy in the USDA record by 0.7% to 10.9% across six foods.
- A 30% protein preset is 120 g at 1,600 kcal, 150 g at 2,000 kcal and 195 g at 2,600 kcal, so the grams per kg move with calories.
- The 2025–2030 Dietary Guidelines set protein at 1.2–1.6 g per kg of body weight, which is 84–112 g at 70 kg.
- A can of light beer is 103 kcal in the USDA record, and its macros explain only 27 kcal because alcohol is 7 kcal per gram.
- A 2024 National Academies committee recommended dropping the 10–35% protein range and its fat and carb counterparts from future reviews.
A macro counting app is only as good as the food record its calories come from, and the number of charts it draws changes nothing. A good one shows protein, fat and carbs in grams, takes the calories from the same food record, and lets you set targets that don’t drift when your calories change. I checked the last two with numbers from USDA records, and ten minutes with your own foods will show how your app does.
Do the grams of protein, fat and carbs add up to the calories?
Only roughly, and the gap depends on which method the app uses. The usual shortcut is the general Atwater factors: 4 kcal per gram of protein, 9 per gram of fat and 4 per gram of carbohydrate. The same source describes a second system, specific factors, which give each food its own numbers. US label rules accept either, so neither is wrong.
They do give different answers. I took six USDA records, added up grams × 4, 9 and 4, and compared the sum with the energy the record reports.
| Food (per 100 g) | Record energy (specific factors) | Protein, fat, carbs × 4, 9, 4 | Difference |
|---|---|---|---|
| Almonds, whole, raw | 584 kcal | 625.8 kcal | +7.2% |
| Bananas, ripe and slightly ripe, raw | 88 kcal | 97.6 kcal | +10.9% |
| Eggs, Grade A, Large, egg whole | 147 kcal | 143.1 kcal | −2.7% |
| Rice, white, long grain, unenriched, raw | 370 kcal | 358.7 kcal | −3.0% |
| Chicken breast, braised | 166 kcal | 157.6 kcal | −5.1% |
| Oats, rolled, old fashioned | 379 kcal | 381.6 kcal | +0.7% |
A banana is about 11% off, and rolled oats are nearly spot on. Almonds come out 7% high because the record’s specific factors give them less energy per gram than 4, 9 and 4 would. Labels add their own blur. The same rules round calories to the nearest 5 up to 50 and the nearest 10 above that, so a pack that says 150 kcal sits anywhere from 145 to 154. Over a whole day, errors with opposite signs partly cancel.
Pick an app that says which method it uses, and stay with it, because switching mid-month moves your totals for no reason. Compare weeks, not single days. The same food logged the same way gives the same number, and that matters more than which method you chose. Two apps can also read different records for one food, which is why the most accurate calorie tracker question has no clean answer.
What happens to alcohol in a macro counting app?
It vanishes from the macros, and it shouldn’t vanish from the calories. Alcohol carries 7 kcal per gram and has no slot in protein, fat or carbs. The USDA record for light beer shows the problem: 29 kcal per 100 g, with 0.24 g of protein and 1.64 g of carbohydrate. Those two add up to 7.5 kcal. The other 21 kcal, about 3 g of alcohol per 100 g by my arithmetic, belong to neither.
The record puts a 354 g can at 103 kcal, but its macros give only 27 kcal. An app that totals macros alone misses 76 kcal per can.
Log one drink and compare. Calories above what the macros explain mean the app counts alcohol.
Do sugar alcohols and fiber break the calorie math?
Sugar alcohols can, and fiber mostly doesn’t. US label rules take sugar alcohols out of the carbohydrate that counts at 4 kcal per gram. Each gets its own factor: erythritol at 0, mannitol 1.6, isomalt and lactitol 2.0, maltitol 2.1, xylitol 2.4, sorbitol 2.6 and hydrogenated starch hydrolysates 3.0 kcal per gram. UK and EU energy rules give polyols 2.4 kcal per gram, erythritol 0 and fiber 2 (Annex XIV).
An app that multiplies total carbohydrate by 4 treats every one of those grams as fully digestible. Here is a bar I made up to show the size of the error: 15 g protein, 8 g fat and 22 g total carbohydrate, of which 9 g is maltitol.
| Method | Calories |
|---|---|
| Protein, fat and carbs × 4, 9 and 4 | 220 kcal |
| Label rule: maltitol taken out of the carbs and counted at 2.1 | 203 kcal |
| The same bar with erythritol in place of maltitol | 184 kcal |
The label rule prints the second figure as 200 kcal, because calories round to the nearest 10 above 50 (21 CFR 101.9). The shortcut overstates the maltitol bar by 17 kcal (about 8%) and the erythritol bar by 36 kcal (about 20%). The 4, 9 and 4 shortcut itself is tested on real foods in calories per gram of protein, carbs and fat.
Fiber moves the answer far less. In the USDA record, a cup of boiled lentils (198 g) holds 15.6 g of fiber and 230 kcal, and its protein, fat and carbs at 4, 9 and 4 add up to 238. That is a gap of 8 kcal, or 3.5%.
To see what your app does, log a packaged food that has a sugar alcohol line, using the label’s own calories. Then look at what the screen says after you type the macros. Some apps recompute calories from the macros and show 220 where the label says 200. A gap that size is easy to live with for an occasional bar. Eat one daily and it matters.
How should I set targets: grams, percent or grams per kilogram?
Set protein in grams per kilogram and let the rest follow. The 2025–2030 Dietary Guidelines for Americans set a protein serving goal of 1.2–1.6 g per kg of body weight a day, adjusted to your calorie needs. For a 70 kg adult that’s 84–112 g.
Percent presets hide a trap. A 30% protein preset sounds fixed, and the grams move with your calories. I worked out the same 70 kg person at three calorie levels:
| Calories a day | Protein at 30% of calories | Protein per kg at 70 kg |
|---|---|---|
| 1,600 kcal | 120 g | 1.7 g/kg |
| 2,000 kcal | 150 g | 2.1 g/kg |
| 2,600 kcal | 195 g | 2.8 g/kg |
Even at 1,600 kcal the preset sits above the Guidelines’ top figure of 1.6 g/kg, and at 2,600 kcal it’s well beyond it. The official percent ranges are wide: the National Academies table gives adults 45–65% of energy from carbohydrate, 20–35% from fat and 10–35% from protein. On 2,000 kcal that’s 225–325 g of carbs, 44–78 g of fat and 50–175 g of protein.
Those ranges may not last. A 2024 National Academies committee concluded that the method used to derive them is not consistent with current evidence-based standards, and it recommended dropping them from future reviews. Until something replaces them, use them as rough bounds, not as targets.
This is my own order of operations, with no published equation behind it: protein in g/kg first, then fat and carbs fill the remaining calories. On keto the order flips and net carbs come first, which the keto diet tracker post covers.
What does a protein target look like on a plate?
Start with the arithmetic. At 1.6 g/kg, a 70 kg adult’s 112 g of protein is 448 kcal, which is 28% of a 1,600 kcal day and 22% of a 2,000 kcal day. The tighter the calories, the more the choice of food matters. This table prices 30 g of protein, about a quarter of that target, in six foods. Every figure comes from the USDA record.
| Food | Grams that carry 30 g of protein | Calories that costs |
|---|---|---|
| Chicken breast, braised | 94 g | 155 kcal |
| Greek yogurt, plain, nonfat | 291 g | 178 kcal |
| Eggs, large | 242 g (about 5 eggs) | 356 kcal |
| Lentils, boiled | 333 g | 386 kcal |
| Almonds, raw | 140 g | 817 kcal |
| Rolled oats, dry | 222 g | 842 kcal |
Chicken and nonfat Greek yogurt deliver the 30 g for under 180 kcal. Eggs and lentils cost about twice that, and almonds or dry oats cost over 800. That ranks nothing, because almonds and oats bring fat, fiber and carbs you may want. It does show how fast protein adds up across a day, which is why a gram goal needs a tracker that totals every food.
How do I test a macro counting app in ten minutes?
Log five foods whose answers you can look up. Each is picked to catch a different fault, and the run takes about ten minutes. The expected values come from USDA FoodData Central.
| Log this | Expect | A miss means |
|---|---|---|
| 1 banana, peeled, 115 g | 101 kcal, 0.9 g protein, 0.3 g fat, 26 g carbs | Near 112 kcal: the app multiplies by 4, 9 and 4 instead of using the record’s energy |
| 1 large egg, 50.3 g | 74 kcal, 6.2 g protein, 5.0 g fat, 0.5 g carbs | A different figure: the app picked its own egg size |
| Chicken breast, braised, 100 g | 166 kcal, 32.1 g protein, 3.2 g fat | 22.5 g protein: the app matched your cooked chicken to the raw entry |
| Olive oil, 1 tablespoon, 13.5 g | 119 kcal, 13.5 g fat | About 40 kcal: it logged a teaspoon |
| Light beer, 1 can, 354 g | 103 kcal, 0.8 g protein, 5.8 g carbs | About 27 kcal: alcohol is missing |
Read the rows one at a time. The banana tells you which energy method the app uses, and I’d accept either as long as it never changes. The egg checks the default portion, the chicken checks the food’s state, and the oil checks the unit. The beer repeats the alcohol test from earlier. Weigh the chicken and the oil instead of trusting a cup, in the order that how to weigh food lays out.
Then edit one entry. Change the banana to 60 g and watch whether the calories and all three macros move together. If only the calories move, the macro totals stop describing your day.
Two things the table can’t show are whether protein can be set per kilogram and whether you can export. Both sit on the checklist at the end.
How fast does a macro counting app need to be?
Quick enough that month six still finds you logging. In a 24-week online weight-control program, 142 adults spent an average of 23.2 minutes a day logging food in month 1 and 14.6 minutes in month 6. Only 65.5% were still recording by then. I read that as a reason to pick the app that’s quickest for your usual meals.
Time yourself on your usual breakfast, and keep the method you’d still use on a tired Tuesday. Free tiers differ on gram goals and export, so the free calorie counter app comparison is worth a look before you commit.
To compare two apps fairly, run the same five foods in both, in the same order, and note the seconds from opening the app to the saved entry. Multiply the slower app’s average by the number of times you eat in a normal day. If that total lands well above the 14.6 minutes a day that Harvey’s participants still spent at month 6, take another look at the faster one.
The macro checklist below is short enough to screenshot. For the wider tests, see how to choose a calorie counter app.
- Protein, fat and carbs show in grams.
- Each entry’s calories come from a named record, and the macros are checked against it.
- An alcoholic drink adds calories the macros can’t explain.
- You can set protein per kilogram, or edit the grams directly.
- You can change the grams of an entry after you log it.
- You can export your diary.
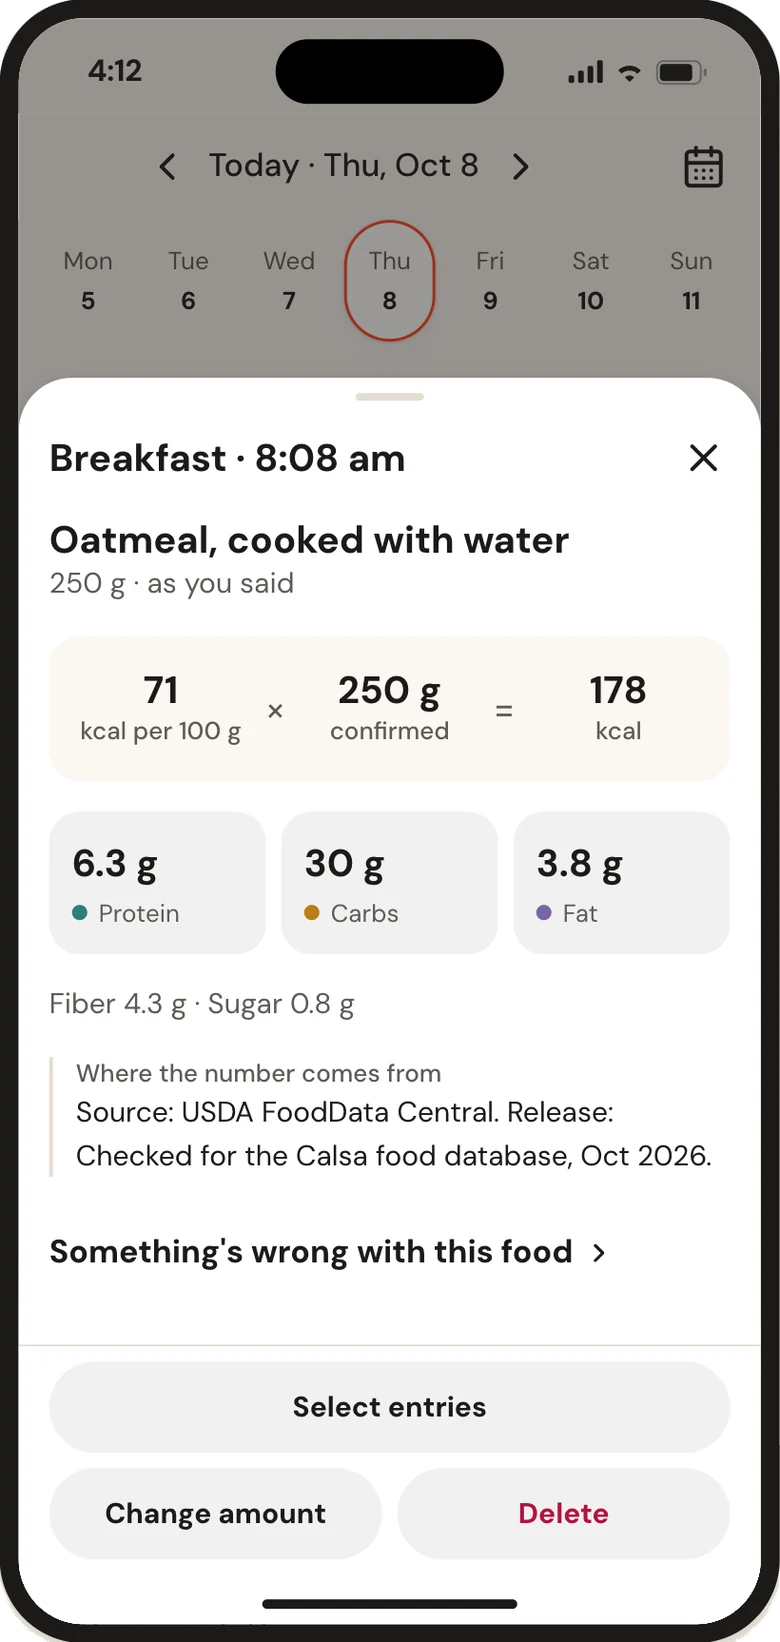
I write for Calsa, a subscription app, so factor that in. It shows calories, protein, fat, carbs, fiber and sugar, and lets you edit calories or macros so the other adjusts. Every entry carries its source and the per 100 g × grams arithmetic. It falls short if you need a tier you can stay on without paying, a watch app, or a database as big as the biggest trackers have.
Questions and answers
What is a macro counting app?
It's a food tracker that totals protein, fat and carbohydrate in grams as well as calories. A good one takes the calories from the same food record as the grams and lets you set targets in grams, percent or grams per kilogram. Check the calories against a record such as USDA's before you trust the totals.
Do macros add up to the calories on the label?
Roughly. Multiplying grams by 4, 9 and 4 gives a close figure, but the energy in a USDA record differs from it by up to 11% for a banana. Alcohol adds calories that protein, fat and carbs can't explain.
How many grams of protein should a macro tracker target?
The 2025–2030 Dietary Guidelines for Americans give 1.2–1.6 g per kg of body weight a day, adjusted to calorie needs. That is 84–112 g for a 70 kg adult. People with kidney disease, and anyone pregnant, should set the number with a doctor or midwife.
Is a macro protein and calorie tracker different from a calorie counter?
Only in what it shows. A protein and calorie tracker puts grams of protein next to calories, and a full macro counter adds fat and carbs. The checks are the same: where the calories come from, and whether you can set protein per kilogram.
Sources
- Calculation of the Energy Content of Foods: Energy Conversion Factors (Chapter 3), FAO
- 21 CFR 101.9 Nutrition labeling of food, Legal Information Institute, Cornell Law School
- Nuts, almonds, whole, raw (Foundation, FDC ID 2346393), USDA FoodData Central
- Bananas, ripe and slightly ripe, raw (Foundation, FDC ID 1105314), USDA FoodData Central
- Eggs, Grade A, Large, egg whole (Foundation, FDC ID 748967), USDA FoodData Central
- Rice, white, long grain, unenriched, raw (Foundation, FDC ID 2512381), USDA FoodData Central
- Chicken, broiler or fryers, breast, skinless, boneless, meat only, cooked, braised (Foundation, FDC ID 331960), USDA FoodData Central
- Oats, whole grain, rolled, old fashioned (Foundation, FDC ID 2346396), USDA FoodData Central
- Alcoholic beverage, beer, light (SR Legacy, FDC ID 168749), USDA FoodData Central
- Regulation (EU) No 1169/2011, Annex XIV: conversion factors for the calculation of energy (retained in UK law), legislation.gov.uk
- Lentils, mature seeds, cooked, boiled, without salt (SR Legacy, FDC ID 172421), USDA FoodData Central
- Dietary Guidelines for Americans, 2025–2030, U.S. Department of Health and Human Services and U.S. Department of Agriculture
- Dietary Reference Intakes: Macronutrients (table of RDA/AI and AMDR), National Academies of Sciences, Engineering, and Medicine
- Rethinking the Acceptable Macronutrient Distribution Range for the 21st Century: A Letter Report (2024), Conclusions and recommendations, National Academies of Sciences, Engineering, and Medicine
- Yogurt, Greek, plain, nonfat (Foundation, FDC ID 330137), USDA FoodData Central
- Chicken, broiler or fryers, breast, skinless, boneless, meat only, raw (SR Legacy, FDC ID 171077), USDA FoodData Central
- Oil, olive, salad or cooking (SR Legacy, FDC ID 171413), USDA FoodData Central
- Harvey J, Krukowski R, Priest J, West D. Log Often, Lose More: Electronic Dietary Self-Monitoring for Weight Loss. Obesity 2019, Obesity