Most Accurate Calorie Tracker? Why Apps Disagree on the Same Food
Calorie trackers disagree because they read different records, states and portions. One banana is 101 to 113 kcal in USDA's own records, and rice is 2.8 times denser dry than cooked.
Key takeaways
- USDA records give 101 to 113 kcal for one banana (115 g), depending on the record and on general or specific Atwater factors.
- Dry rice has 365 kcal per 100 g and cooked rice 130, a ratio of 2.8, so logging the wrong state is the biggest single slip.
- A cup of cooked spaghetti weighs 124 g not packed and 151 g packed, which is 195 kcal against 237 kcal.
- US rules let a packaged food's calories run up to 20 percent above the label before it counts as misbranded.
- In three published checks, apps agreed with national databases very differently by app, nutrient and food group.
There is no single most accurate calorie tracker, because apps disagree about the same food for plain reasons. They read different records, in different states, at different portion sizes. For one banana, USDA’s own records give 101 to 113 kcal. Across apps the gap gets wider.
Why do two apps give different calories for the same food?
They are looking at different records. A record is one row in a food database: a name, a state, a number per 100 g and a list of portions. USDA’s FoodData Central holds several records for a banana, and an app built on it can use any one of them.
I priced one banana from three of them. USDA also publishes energy two ways, with general and with specific Atwater factors. Those factors are the calories-per-gram multipliers for protein, fat and carbohydrate, and the specific set is tuned to each food. That’s a second source of difference, and it is why a macro counting app should take its calories from the same record as its grams.
| Record | Type | kcal per 100 g | Banana weight | One banana |
|---|---|---|---|---|
| Bananas, ripe and slightly ripe, raw (1105314), specific factors | Foundation | 88 | 115 g | 101 kcal |
| Same record, general factors | Foundation | 98 | 115 g | 113 kcal |
| Bananas, ripe and slightly ripe, raw (790991) | Foundation | 97 | 115 g | 112 kcal |
| Bananas, raw (173944), one medium | SR Legacy | 89 | 118 g | 105 kcal |
None of these is wrong. Same fruit, same database. The spread is 12 kcal, about 11%, and it comes from the database alone. I use the specific number where a record has one, and I say which record it came from.
Pick one record and stay with it for a week. Switching records mid-week adds noise you can’t tell from real change.
Which foods does the energy method move most?
USDA’s Foundation records for many foods carry both the general and the specific figure, so you can see where the choice matters. Per 100 g:
| Record | General factors (kcal) | Specific factors (kcal) | Gap (kcal) |
|---|---|---|---|
| Spinach, baby (1750352) | 26.6 | 20.7 | 5.9 |
| Apples, fuji, with skin, raw (1105897) | 65 | 58 | 7 |
| Nuts, almonds, whole, raw (2346393) | 625.8 | 583.6 | 42.2 |
| Peanut butter, creamy (2262072) | 631.7 | 589.4 | 42.3 |
In these records the percentage gap is largest for spinach, 22% of the higher figure, and smallest for the nuts, about 7%. The calorie gap runs the other way. A 1 oz (28.35 g) handful of almonds differs by 12 kcal between the two methods, and 100 g of spinach by 6 kcal. Dense foods like these are where the method costs real calories. Greens cost a few. I take the specific figure wherever a record has one, so an almond entry reads 584 kcal per 100 g instead of 626.
Why do raw, cooked and “one cup” change the number?
Raw against cooked changes it by a factor of two to five. A gram of dry rice has about 2.8 times the energy of a gram of cooked rice, because cooking adds water and no calories. An app that lets you log “rice, 100 g” without a state is guessing which one you meant.
| Food | State | kcal per 100 g | Record |
|---|---|---|---|
| White rice | raw | 365 | FDC 168877 |
| White rice | cooked | 130 | FDC 168878 |
| Oats | dry | 379 | FDC 173904 |
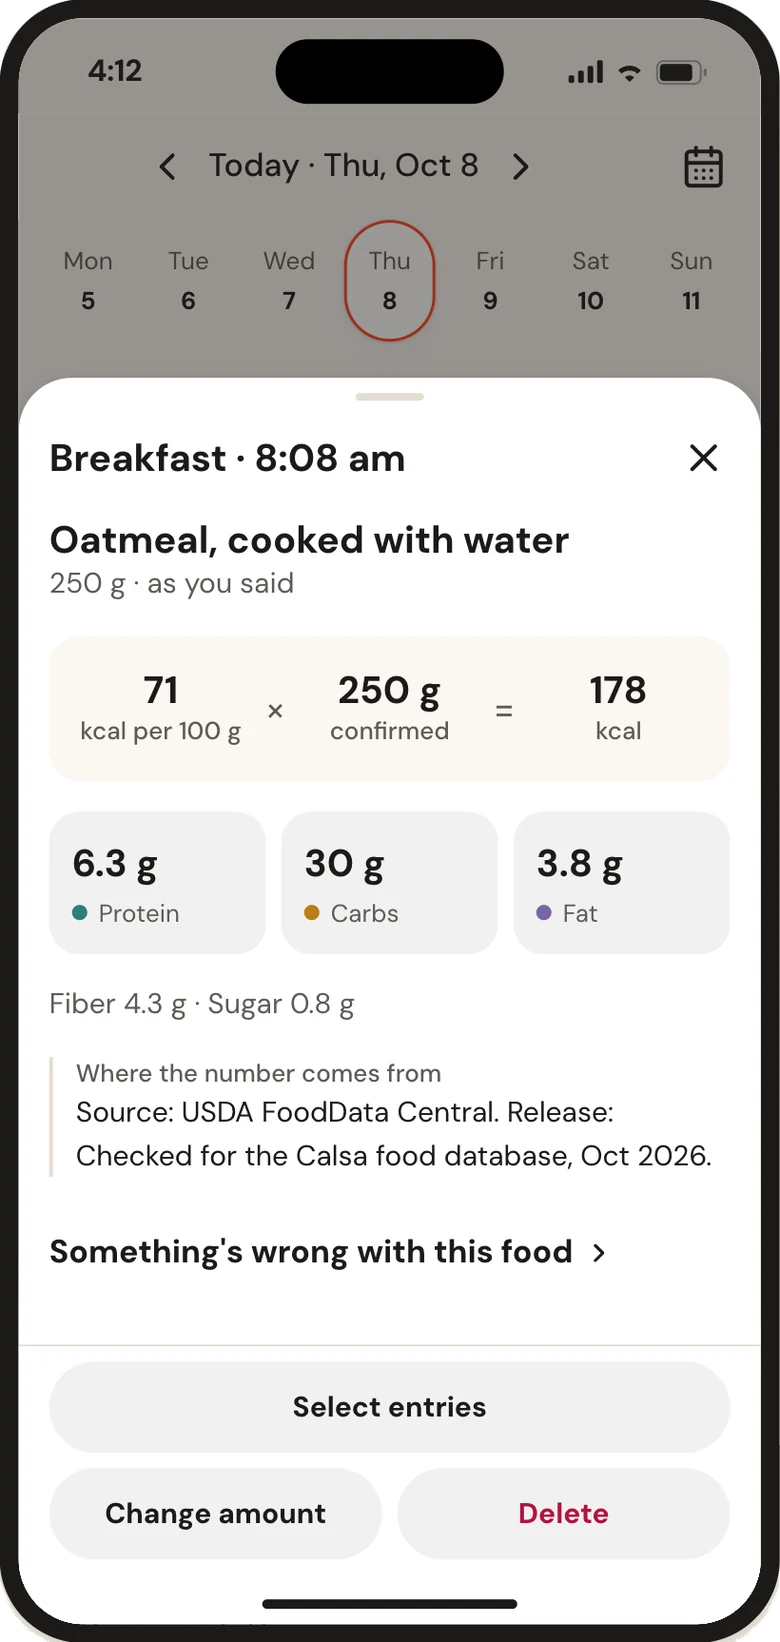
| Oats | cooked with water | 71 | FDC 173905 |
| Pasta | dry | 371 | FDC 169736 |
| Pasta | cooked | 157 | FDC 169751 |
The ratios work out to 2.8 for rice, 5.3 for oats and 2.4 for pasta. Weigh 80 g of cooked rice and log it as dry, and you record 292 kcal for a plate that holds 104. State first, always.
Write down the state when you weigh. If the app doesn’t ask, put “cooked” in the note.
A cup is worse. Its weight depends on how hard you pack it. The pasta record gives two weights for a cup of cooked spaghetti, 124 g not packed and 151 g packed. At 157 kcal per 100 g, that is 195 kcal against 237 kcal. A cup of cooked elbows runs 120 g to 132 g, or 188 to 207 kcal.
Apps with a “cup” button pick a weight for you. Two apps can disagree by this much on the same food, and neither is faulty.
Use grams for anything dense: pasta, rice, nuts, oil, cereal. Cups are fine for leafy greens.
Why can “one medium potato” agree across records when 100 g does not?
Each record pairs its own energy per 100 g with its own idea of a medium potato. USDA lists a medium raw potato at 213 g and a medium baked Russet at 173 g.
| Record | State | kcal per 100 g | “1 medium” | One medium potato |
|---|---|---|---|---|
| Potatoes, flesh and skin, raw (170026) | raw | 77 | 213 g | 164 kcal |
| Potatoes, Russet, flesh and skin, baked (170030) | baked | 95 | 173 g | 164 kcal |
| Potatoes, boiled, cooked without skin, flesh, without salt (170440) | boiled, peeled | 86 | 167 g | 144 kcal |
Tap “one medium” and the raw and baked records agree at 164 kcal. Weigh the potato and they split. A baked potato of 173 g logged against the raw record comes to 133 kcal, 31 kcal short, about 19%. A raw potato of 213 g logged against the baked record comes to 202 kcal, 38 kcal over, about 23%.
Use “medium” when you don’t weigh. When you do, match the state, as the post on how to weigh food explains.
How far apart do real apps land?
Often further apart than one record suggests, and it varies by app and by food. Three published checks give a feel for it. All are snapshots, and the apps have been updated since.
In 2022, a study in the Journal of the Academy of Nutrition and Dietetics set four commercial apps against a research database. The database was the Nutrition Data System for Research, and the test used the 50 foods eaten most often in a weight-loss study. One app agreed almost perfectly (intraclass correlation 0.90 to 1.00). The weakest ran from 0.52 to 0.98, and its fiber agreement for vegetables fell to 0.16. On energy, a different app had the poorest agreement: an average gap of 8 kcal per food item, but a standard deviation of 133 kcal.
A Japanese team took one-day food records from 30 adults and entered them into five diet-tracking apps. They compared the totals with Japan’s national food tables. Four of the five overestimated median energy. The same diary gave a different day depending on which app held it.
The 2024 comparison of five apps with the USDA and Taiwanese national databases looked at 836 food codes for 42 items. Four apps underestimated saturated fat by 13.8% to 40.3%, and all five underestimated cholesterol by 26.3% to 60.3%. That study looked at fat, not energy. Still, it shows how an entry can lack a nutrient or get it wrong while the calorie total looks fine.
Then there is the label itself. US rules allow a packaged food’s calories to run up to 20 percent above the declared value before it counts as misbranded. A 400 kcal label can hold 480.
How much of the label gap is only rounding?
The same rule rounds calories per serving to the nearest 10 above 50 and the nearest 5 up to 50. A serving under 5 kcal may be listed as zero. A label that reads 110 kcal can hold roughly 105 to 115. Eat a pack of 8 servings and rounding alone can move the total by up to 40 kcal either way. A sauce or spray that lists 0 kcal can hold nearly 5 per serving, so ten servings add nearly 50 kcal that no label shows.
Beside the 20 percent allowance, rounding is small. It grows with every serving you eat, and the allowance does not.
Which calorie tracker is the most accurate?
None can be named honestly from the outside. The studies above tested a handful of apps at one moment on one set of foods. The rank order changed with the nutrient and the food group, and the tested versions have since been updated.
So I stopped asking which app and started asking what an app does with a number. An entry is likely to match your scale when the app does these:
- It names the record and the state: cooked, raw, with skin.
- It shows the grams behind the number and lets you change them.
- It gives the same answer when you log the same entry twice.
An app that does all three can still inherit the label’s own tolerance. At least you can see where. How to choose a calorie counter app turns this into a longer test.
Are meal kit calories and macros accurate?
Mostly, on the box, and less so on your plate. A 2023 study in Public Health Nutrition bought 36 meals from two Australian meal kit services over six weeks. The researchers analyzed the food actually supplied and compared it with the nutrition panel on each recipe card. The panels were close to their calculation, except for sodium. The authors flag the small sample and a home kitchen instead of a lab.
The recipes in that study also assumed pantry staples such as olive oil and butter that weren’t in the box. That is where plates drift. The oil is a record I can price: 13.5 g of olive oil is 119 kcal, and 40.5 g is 358 kcal. If the recipe says one tablespoon and you pour three, you added 238 kcal the card knows nothing about.
Treat the printed number as the kit’s. Weigh the oil, the butter and the sauce, and log each as its own entry, so you can see what the box did and what you did. Oil matters most if you cook the Mediterranean way, which the Mediterranean diet app piece counts in tablespoons.
How can you check your own tracker in ten minutes?
Pick three foods you eat every week. Weigh each one, then find its record on USDA’s site, and compute kcal per 100 g times your grams. Then log the same food in your app and compare. Do it on the free version before you pay, since the tiers of a free calorie counter app leave out different things.
How do I read the gap I find?
Each cause leaves a gap of a typical size. Match yours to the table. The figures come from the banana and pasta records and the labeling rule.
| Gap between your app and your sum | Likely cause | Fix |
|---|---|---|
| About 7% to 22% on one food | A different record or energy method: one banana is 101 or 113 kcal, and baby spinach 20.7 or 26.6 kcal per 100 g | Keep one record and the specific figure |
| About 20% on cooked pasta by the cup | The cup weighs 124 g or 151 g: 195 or 237 kcal | Switch to grams |
| 2.4 to 5.3 times | Raw logged as cooked, or the reverse | Change the state |
| Up to 20% on a packaged food | Label tolerance | Keep the label number and use it consistently |
| About 19% to 23% on a potato | Weighed in one state, logged in another | Match the state |
If the numbers match, the app handles those foods well. If not, the gap is usually one of the four causes above, and you can find which. In Calsa each entry shows where its calories come from and the math, per 100 g × grams, and an amount you haven’t confirmed is marked as an estimate. Log the same food twice and you get the same number. A wrong shared entry can be reported.
Questions and answers
Why does my calorie tracker show different calories than another app?
The apps probably read different database records for the same food. One banana is 101 to 113 kcal across USDA records, and a cup of cooked pasta is 195 or 237 kcal depending on how it is packed. State (raw or cooked), portion weight and the energy method all move the number.
Are calorie counts on food labels exact?
No. In the US, a food is misbranded only if its calories are more than 20 percent above the declared value. A label that says 400 kcal can legally hold 480. Treat it as the best number you have, and use it consistently.
How many calories are in a cup of cooked pasta?
It depends on what the cup weighs. In one USDA record, a cup of cooked spaghetti is 124 g not packed (195 kcal) or 151 g packed (237 kcal). Weigh the pasta and use a cooked record, because dry pasta has 371 kcal per 100 g and cooked has 157.
Should I trust the calories on a meal kit recipe card?
Mostly, for the food in the box. In a 2023 check of 36 meals from two Australian kit services, the cards were close to a recalculation, except for sodium. Your own oil, butter and sauces are extra: one extra tablespoon of olive oil is 119 kcal.
Why does a potato have different calories in different apps?
Each USDA record pairs its own energy per 100 g with its own weight for a medium potato. A medium raw potato (213 g) and a medium baked Russet (173 g) both come to about 164 kcal, yet 100 g is 77 kcal raw and 95 kcal baked. Weigh the potato in the state your entry names.
Sources
- Bananas, ripe and slightly ripe, raw (Foundation, FDC ID 1105314), USDA FoodData Central
- Bananas, ripe and slightly ripe, raw (Foundation, FDC ID 790991), USDA FoodData Central
- Bananas, raw (SR Legacy, FDC ID 173944), USDA FoodData Central
- Spinach, baby (Foundation, FDC ID 1750352), USDA FoodData Central
- Apples, fuji, with skin, raw (Foundation, FDC ID 1105897), USDA FoodData Central
- Nuts, almonds, whole, raw (Foundation, FDC ID 2346393), USDA FoodData Central
- Peanut butter, creamy (Foundation, FDC ID 2262072), USDA FoodData Central
- Rice, white, long-grain, regular, raw, enriched (SR Legacy, FDC ID 168877), USDA FoodData Central
- Rice, white, long-grain, regular, enriched, cooked (SR Legacy, FDC ID 168878), USDA FoodData Central
- Cereals, oats, regular and quick, not fortified, dry (SR Legacy, FDC ID 173904), USDA FoodData Central
- Cereals, oats, regular and quick, unenriched, cooked with water, without salt (SR Legacy, FDC ID 173905), USDA FoodData Central
- Pasta, dry, enriched (SR Legacy, FDC ID 169736), USDA FoodData Central
- Pasta, cooked, enriched, with added salt (SR Legacy, FDC ID 169751), USDA FoodData Central
- Potatoes, flesh and skin, raw (SR Legacy, FDC ID 170026), USDA FoodData Central
- Potatoes, Russet, flesh and skin, baked (SR Legacy, FDC ID 170030), USDA FoodData Central
- Potatoes, boiled, cooked without skin, flesh, without salt (SR Legacy, FDC ID 170440), USDA FoodData Central
- Lin AW, et al. Comparative Validity of Mostly Unprocessed and Minimally Processed Food Items Differs Among Popular Commercial Nutrition Apps Compared with a Research Food Database. J Acad Nutr Diet 2022, Journal of the Academy of Nutrition and Dietetics
- Shinozaki N, Murakami K. Evaluation of the Ability of Diet-Tracking Mobile Applications to Estimate Energy and Nutrient Intake in Japan. Nutrients 2020, Nutrients
- Ho DKN, et al. Reliability Issues of Mobile Nutrition Apps for Cardiovascular Disease Prevention: Comparative Study. JMIR mHealth and uHealth 2024, JMIR mHealth and uHealth
- 21 CFR 101.9 Nutrition labeling of food, paragraph (g)(5), U.S. Code of Federal Regulations (eCFR)
- McKay FH. What's in a commercial meal kit? Structured review of Australian meal kits. Public Health Nutr 2023, Public Health Nutrition
- Oil, olive, salad or cooking (SR Legacy, FDC ID 171413), USDA FoodData Central