What Are Macros? Protein, Carbs and Fat Explained
Macros are protein, carbohydrate and fat, the three nutrients that supply almost all the calories in food. Protein and carbohydrate give 4 kcal per gram, and fat gives 9.
Key takeaways
- Macros are protein, carbohydrate and fat, and the Dietary Guidelines list vitamins, minerals and fiber as separate groups.
- Protein and carbohydrate give 4 kcal per gram, fat gives 9 kcal per gram, and alcohol gives 7 kcal per gram without being a macro.
- Adults can take 10–35% of calories from protein, 45–65% from carbohydrate and 20–35% from fat, which at 2,000 kcal is 50–175 g, 225–325 g and 44–78 g.
- A whole egg gets 63% of its energy from fat, and boiled lentils get 67% from carbohydrate.
- In a 2009 trial of 811 adults, two-year weight loss was 3.0 kg on 15% protein and 3.6 kg on 25%.
Macros are protein, carbohydrate and fat, the three nutrients that supply almost all the calories in food. Protein and carbohydrate give 4 kcal per gram, and fat gives 9. Adults can draw 10–35% of their calories from protein, 45–65% from carbohydrate and 20–35% from fat under the ranges in the Dietary Guidelines for Americans.
What are macros in nutrition?
The word is short for macronutrients, and “macro” refers to amount: your body needs these nutrients in large quantities, counted in grams rather than milligrams. Vitamins and minerals sit in a separate group in the Guidelines.
When people ask “what are my macros,” they usually mean the day’s grams of those three. Log them next to your calories and you’re counting macros. A food app that draws one bar for each shows the same thing.
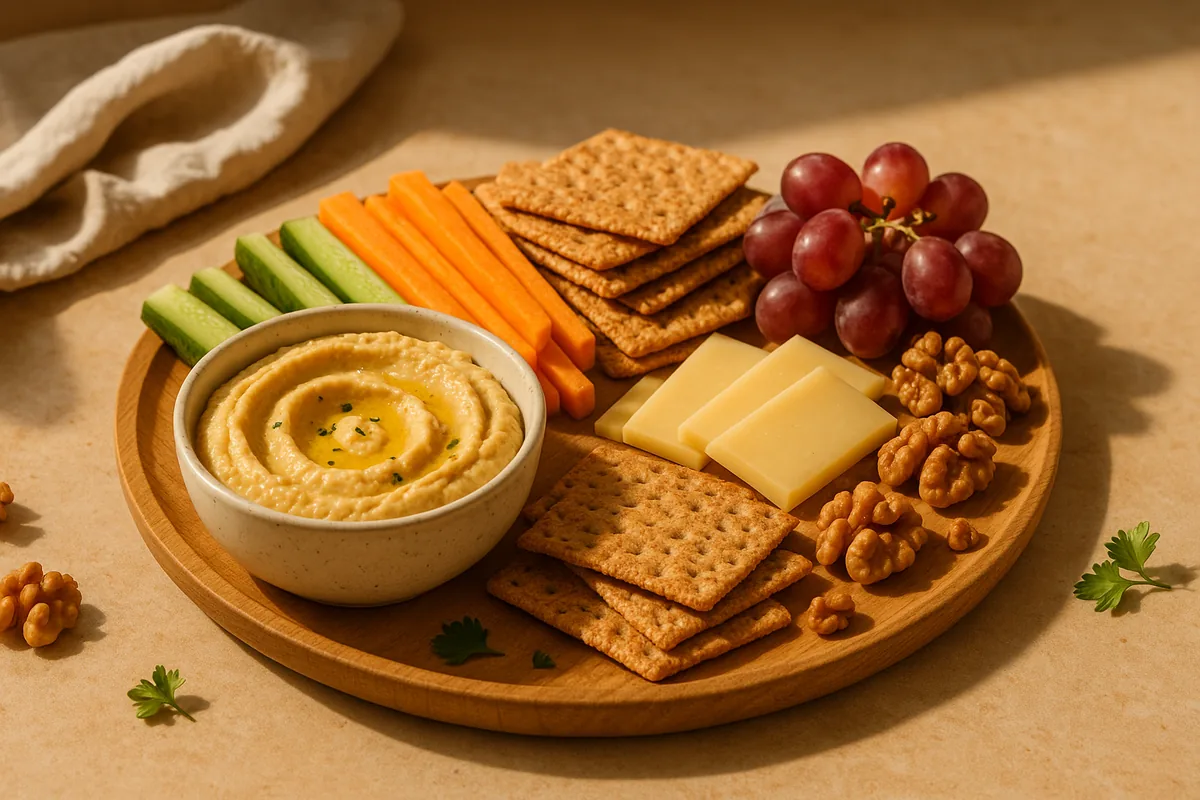
Most foods are mixtures. An egg has protein and fat. Rice is mostly carbohydrate with a little protein. Only a few foods, olive oil being the clearest, come close to a single macro. That’s why a macro is a nutrient and not a food group.
Are fiber, alcohol and water macros?
Not in the standard definition. The Guidelines text names dietary fiber as a food component, apart from the three macronutrients. In a food record, fiber still counts inside carbohydrate, because the Atwater general system calculates carbohydrate by difference, as the FAO chapter describes.
Alcohol is the odd one out. It supplies 7 kcal per gram, yet it isn’t protein, fat or carbohydrate. Its calories take a share of your day and show up in none of the three macro grams.
Water gives no energy and has no macro grams, so it stays out of the count.
How many calories are in each macro?
Per gram, protein and carbohydrate give 4 kcal. Fat gives 9. These are the Atwater general factors, which the FAO lists as 17 kJ/g for protein, 37 kJ/g for fat and 17 kJ/g for carbohydrate.
| Nutrient | kcal per gram | kJ per gram |
|---|---|---|
| Protein | 4 | 17 |
| Carbohydrate | 4 | 17 |
| Fat | 9 | 37 |
| Alcohol (not a macro) | 7 | 29 |
The math is a sum. Take a meal with 30 g of protein, 20 g of fat and 50 g of carbohydrate. Protein gives 30 × 4 = 120 kcal, fat gives 20 × 9 = 180 kcal and carbohydrate gives 50 × 4 = 200 kcal. The meal is 500 kcal.
Fat carries more than twice the energy per gram, so 20 g of fat adds as much as 45 g of carbohydrate. Use the table when a label lists only grams and you want the calories.
The factors are rounded. Databases apply food-specific factors, so the energy listed for a food can differ from your own sum by a few percent. The same FAO chapter says general factors gave values about 5 percent higher than specific ones in a US comparison. I checked the 4-9-4 sum against eight USDA records in protein calories per gram.
A real breakfast shows the gap. Here is an oat bowl, with grams and macros from each USDA record.
| Food | Grams | Protein | Fat | Carbs |
|---|---|---|---|---|
| Rolled oats, dry | 50 g | 6.7 g | 2.9 g | 34.3 g |
| Banana | 115 g | 0.9 g | 0.3 g | 26.4 g |
| Greek yogurt, plain, nonfat | 150 g | 15.5 g | 0.6 g | 5.5 g |
| Almonds, raw | 10 g | 2.1 g | 5.1 g | 2.0 g |
| Total | 325 g | 25.2 g | 8.9 g | 68.2 g |
The bowl holds 25.2 g of protein, 8.9 g of fat and 68.2 g of carbohydrate. Run the 4, 9 and 4 factors and you get 454 kcal. The records themselves list 440 kcal. A 14 kcal gap on 440 is about 3%, and you can ignore it. I log the listed number and keep the sum as a sanity check.
For US readers, an ounce is 28.35 g. So an ounce of fat is about 255 kcal, and an ounce of protein or carbohydrate about 113 kcal.
What is the difference between macros and calories?
Calories are the total, and macros say where the total comes from. Two foods can both give you 500 kcal and look nothing alike on a plate. I worked out what 500 kcal of five foods weighs and which macros come with it, using the USDA records linked in the table.
| Food (500 kcal of it) | Weight | Protein | Fat | Carbs |
|---|---|---|---|---|
| Chicken breast, braised | 301 g (10.6 oz) | 96.7 g | 9.8 g | 0.0 g |
| Brown rice, cooked | 407 g (14.4 oz) | 11.1 g | 3.9 g | 104.0 g |
| Greek yogurt, plain, nonfat | 820 g (28.9 oz) | 84.4 g | 3.0 g | 29.8 g |
| Almonds, raw | 86 g (3.0 oz) | 18.4 g | 43.8 g | 17.2 g |
| Olive oil | 57 g (2.0 oz) | 0.0 g | 56.6 g | 0.0 g |
The same 500 kcal is 301 g of braised chicken or about four tablespoons of oil. Calories alone don’t tell you whether a day will feel like a lot of food. Macros tell you what that 500 kcal weighs and how much protein comes with it.
What does each macro do in the body?
Each macro has its own job.
Protein helps the body repair cells and build new ones, according to MedlinePlus. Every cell contains it. The same page separates essential amino acids, which food has to supply, from the ones your body makes.
Carbohydrate is the other main fuel. MedlinePlus says sugars and most starches are broken down into glucose, which travels in the blood and is used for energy. Fiber is the part of carbohydrate your body doesn’t break down.
Fat gives you energy and helps your body absorb vitamins, says the National Library of Medicine. It has twice as many calories as protein or carbohydrate. The 9 against 4 kcal per gram in the table above is that fact in numbers.
You can’t drop any of the three. That’s why the Guidelines give each one a range.
How much of each macro do adults need?
Every macro gets a range in the Guidelines, as a share of calories. The ranges below are the Acceptable Macronutrient Distribution Ranges for adults, listed in the Guidelines’ Table A1-2. I applied them to a 2,000 kcal day to turn percentages into grams.
| Macro | Share of calories | Calories at 2,000 kcal | Grams at 2,000 kcal |
|---|---|---|---|
| Protein | 10–35% | 200–700 kcal | 50–175 g |
| Carbohydrate | 45–65% | 900–1,300 kcal | 225–325 g |
| Fat | 20–35% | 400–700 kcal | 44–78 g |
The ranges are wide on purpose, and they’re linked. Protein at 35% plus fat at 35% would leave 30% for carbohydrate, under its 45% floor. You can’t sit at the top of every range on one day.
A per-kilogram version exists for protein too. The Guidelines list a Recommended Dietary Allowance of 46 g a day for women and 56 g for men. The newer 2025–2030 edition sets protein serving goals of 1.2–1.6 g per kilogram of body weight a day, which is 90–120 g at 75 kg. At 60 kg that’s 72–96 g. At 90 kg it’s 108–144 g.
Carbohydrate has a floor in grams too, 130 g a day for adults. Fiber is listed at 14 g per 1,000 kcal, so 28 g on a 2,000 kcal day.
A split such as 25/45/30 means protein, carbohydrate and fat as shares of calories. To get grams, take the share of your calories and divide by the energy per gram: by 4 for protein and carbohydrate, by 9 for fat. At 2,000 kcal, protein at 25% is 500 kcal, and 500 ÷ 4 gives 125 g. Carbohydrate at 45% is 900 kcal, or 225 g. Fat at 30% is 600 kcal, and 600 ÷ 9 gives 67 g. Add 500, 900 and 600 and you’re back at 2,000 kcal. To set grams for your own weight and calories, see what your macros should be.
Going the other way works too. Multiply grams by 4, 9 and 4, add them up, and divide each part by the total. A 25/45/30 split and a set of gram targets describe the same plan in different units. I prefer grams. A food scale reads grams.
To turn your own calorie goal into grams, use the macro calculator. It sets protein, fat and carbohydrate in grams for the calories you give it.
What do macros look like in real food?
Few foods fit one label, so look at the shares. I took eight common foods from USDA FoodData Central and worked out how much of each food’s energy comes from each macro.
| Food and amount | Protein | Fat | Carbs | Energy from protein / fat / carbs |
|---|---|---|---|---|
| Chicken breast, braised, 100 g | 32.1 g | 3.2 g | 0.0 g | 81% / 19% / 0% |
| Egg, whole, large, 50.3 g (1 egg) | 6.2 g | 5.0 g | 0.5 g | 35% / 63% / 3% |
| Greek yogurt, plain, nonfat, 156 g | 16.1 g | 0.6 g | 5.7 g | 70% / 6% / 25% |
| Brown rice, cooked, 180 g | 4.9 g | 1.7 g | 46.0 g | 9% / 7% / 84% |
| Lentils, boiled, 198 g (1 cup) | 17.9 g | 0.8 g | 39.9 g | 30% / 3% / 67% |
| Banana, 115 g | 0.9 g | 0.3 g | 26.4 g | 3% / 3% / 94% |
| Almonds, raw, 30 g | 6.4 g | 15.3 g | 6.0 g | 14% / 73% / 13% |
| Olive oil, 13.5 g (1 tbsp) | 0.0 g | 13.5 g | 0.0 g | 0% / 100% / 0% |
Each row sums to 100%, because the shares use the 4, 9 and 4 kcal factors. Two things stand out. High protein foods are rarely only protein: a whole egg gets 63% of its energy from fat, and lentils get 67% from carbohydrate. And olive oil is the one row with a single macro, which makes oil the easiest thing to undercount. A tablespoon is 119 kcal.
To read any food quickly, find its record, take the grams of each macro and multiply by 4, 9 and 4. The biggest product is the biggest share.
The state of the food changes the grams. Raw chicken breast has 22.5 g of protein per 100 g in its record, and braised breast has 32.1 g. Cooking drives off water, so the same piece of meat packs more protein per gram on the plate. Log what you weigh, in the state you weighed it.
On a pack in the UK, the back or side label gives fat, carbohydrate and protein, along with saturates, sugars and salt. The NHS says the figures are per 100 g or 100 ml, sometimes per portion. It warns that the maker’s idea of a portion may differ from yours. So do one multiplication. A label with 10.3 g of protein per 100 g gives 16.1 g in a 156 g tub, because 10.3 × 156 ÷ 100 = 16.1. Weigh your own portion.
Do I need to count macros?
Calories come first and protein second. In the trials below, the split between fat and carbohydrate made little difference to weight loss, so I wouldn’t track all three without a reason.
In a 2009 trial of 811 adults on reduced-calorie diets, two-year weight loss was 3.0 kg on 15% protein and 3.6 kg on 25%. It was 3.3 kg on both 20% and 40% fat. The authors concluded that reduced-calorie diets give meaningful weight loss whichever macronutrients they stress. In the DIETFITS trial of 609 adults, low-fat and low-carbohydrate diets gave 5.3 kg and 6.0 kg of loss at 12 months. The gap wasn’t statistically significant.
A food’s macro makeup tells you where its energy comes from, and the table of shares above shows that. It says nothing about whether the food is good or bad.
Counting macros earns its place when you train and want to hit a protein number, or when your calories don’t add up, since fat hides the most energy. Comparing two foods with the same calories is a bonus. If you want to try it, how to count macros walks through a full day in grams.
My own routine is short. I check protein every day, calories on most days, and fat and carbohydrate only when the total looks off. A week of full logging beat a month of calories alone. It showed me where my fat was hiding: oil in the pan, a handful of nuts, the dressing.
When someone says they hit their macros, they mean the day’s protein, fat and carbohydrate landed near their targets. Close counts. A carbohydrate total 10 g off is a rounding error. A protein total 40 g short is worth a look, because protein is the target with a body-weight formula behind it.
For today, log one day with grams and read the three macro numbers. Then compare your protein with 1.2–1.6 g per kilogram of body weight. That one comparison shows whether tracking protein would change anything for you. More guides are filed under macros.
Kidney disease, pregnancy, breastfeeding and being under 18 are reasons to ask a professional before you set gram targets. Anyone else can pause counting when it starts to run the day, for a week or a year, and the numbers will still be there on return.
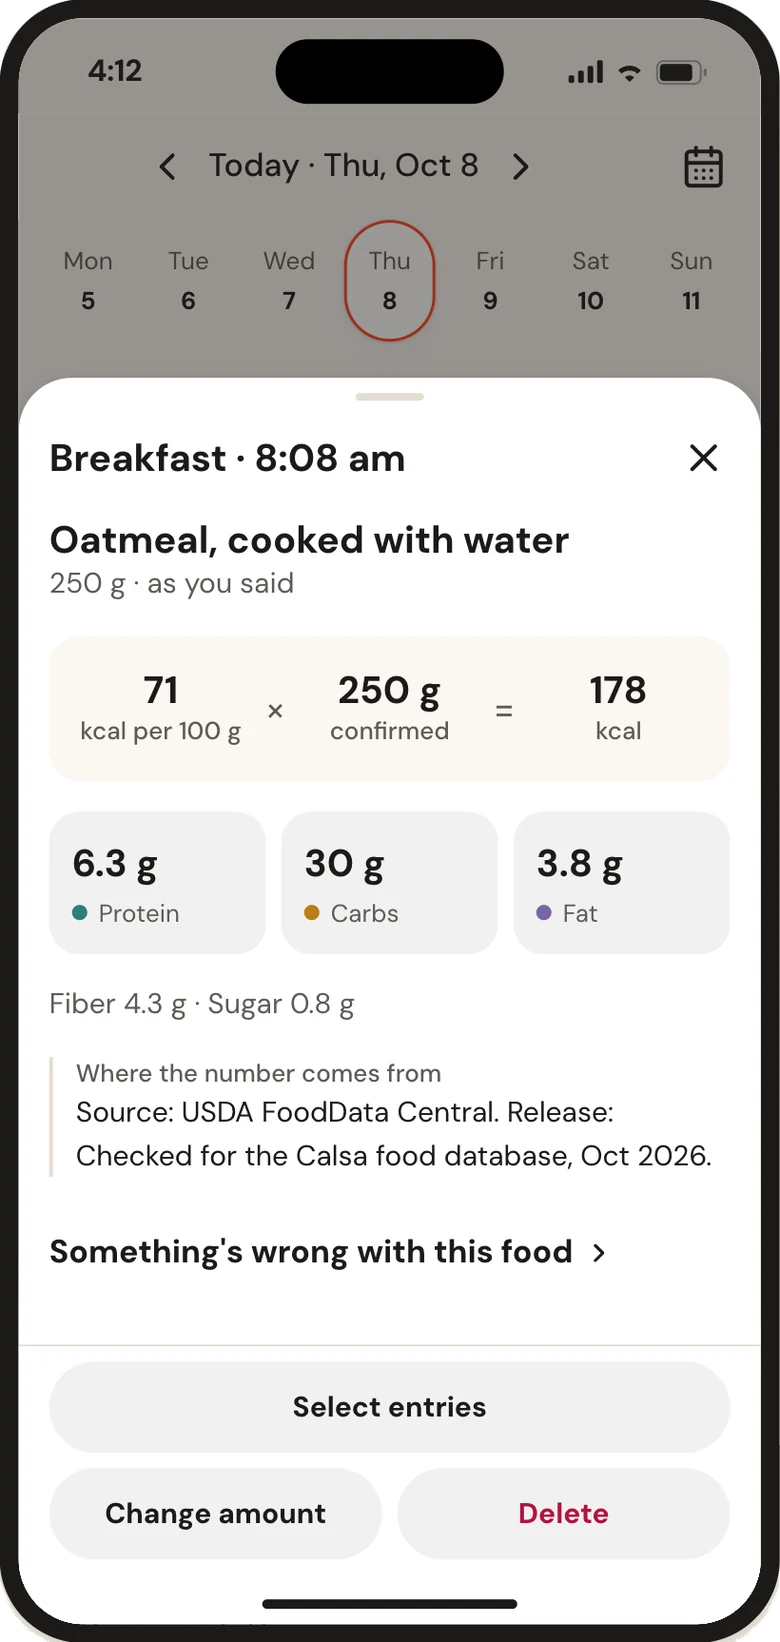
In Calsa, each entry shows its protein, fat and carbohydrate beside the source and the math, “per 100 g × grams.”
Questions and answers
Are macros the same as micros?
No. Macros are protein, carbohydrate and fat, measured in grams. Micros are vitamins and minerals such as vitamin C and iron, which the Dietary Guidelines list as a separate group from the three macros.
Do I need to hit my macros exactly?
No. The Guidelines give ranges, such as 45–65% of calories from carbohydrate, not single numbers. My own rule is a weekly average within 10% of the protein target, so for a 120 g target that means 108–132 g.
Is a gram of fat always 9 calories?
On paper, yes, but food records use slightly different factors. The FAO reports fat factors from 8.37 to 9.02 kcal per gram. The olive oil record lists 884 kcal per 100 g, or 8.84 kcal per gram.
Is fiber counted in carbs?
Yes, in total carbohydrate. The Atwater general system calculates carbohydrate by difference, so fiber sits inside it. The Guidelines goal for fiber is 14 g per 1,000 kcal, which is 28 g on a 2,000 kcal day.
Sources
- Dietary Guidelines for Americans, 2020–2025, including Appendix 1, Table A1-2, Daily Nutritional Goals, Ages 2 and Older, U.S. Department of Health and Human Services and U.S. Department of Agriculture
- Calculation of the energy content of foods: energy conversion factors, Food and Agriculture Organization of the United Nations
- Oats, whole grain, rolled, old fashioned (Foundation, FDC ID 2346396), USDA FoodData Central
- Bananas, ripe and slightly ripe, raw (Foundation, FDC ID 1105314), USDA FoodData Central
- Yogurt, Greek, plain, nonfat (Foundation, FDC ID 330137), USDA FoodData Central
- Nuts, almonds, whole, raw (Foundation, FDC ID 2346393), USDA FoodData Central
- Chicken, broiler or fryers, breast, skinless, boneless, meat only, cooked, braised (Foundation, FDC ID 331960), USDA FoodData Central
- Rice, brown, long-grain, cooked (Includes foods for USDA's Food Distribution Program) (SR Legacy, FDC ID 169704), USDA FoodData Central
- Oil, olive, salad or cooking (SR Legacy, FDC ID 171413), USDA FoodData Central
- Protein in diet, MedlinePlus, National Library of Medicine
- Carbohydrates, MedlinePlus, National Library of Medicine
- Dietary Fats, MedlinePlus, National Library of Medicine
- Dietary Guidelines for Americans, 2025–2030, U.S. Department of Health and Human Services and U.S. Department of Agriculture
- Eggs, Grade A, Large, egg whole (Foundation, FDC ID 748967), USDA FoodData Central
- Lentils, mature seeds, cooked, boiled, without salt (SR Legacy, FDC ID 172421), USDA FoodData Central
- Chicken, breast, boneless, skinless, raw (Foundation, FDC ID 2646170), USDA FoodData Central
- How to read food labels, NHS
- Sacks FM, et al. Comparison of weight-loss diets with different compositions of fat, protein, and carbohydrates. N Engl J Med 2009, New England Journal of Medicine
- Gardner CD, et al. Effect of Low-Fat vs Low-Carbohydrate Diet on 12-Month Weight Loss in Overweight Adults and the Association With Genotype Pattern or Insulin Secretion: The DIETFITS Randomized Clinical Trial. JAMA 2018, JAMA