AI Calorie Counters: How Photo Estimates Work and What to Check
An AI calorie counter prices what it sees in a photo, and the portion is the weak link. In one 2025 test its average error fell from 123 kcal to 53 kcal once ingredient grams were added.
Key takeaways
- In a 2025 test of 195 dishes, ChatGPT-5's average energy error fell from 123.03 kcal with a photo alone to 53.33 kcal when ingredient amounts were added.
- In the Nutrition5k study, a model predicted calories per gram with 9.5% error, but total calories from a photo with 26.1% error.
- Photo-based tests report average energy errors of about 24% to 36%, and models underestimate more as the portion grows.
- A chicken salad is 216 kcal as photographed and 460 to 589 kcal with dressing and cheddar, and the camera cannot see the dressing.
A calorie counter AI turns a photo, a typed line or a spoken sentence into foods, grams and calories. The photo is the weak link. In a 2025 test, ChatGPT-5 missed the energy of 195 dishes by an average of 123 kcal from the photo alone. Add ingredient amounts and the miss fell to 53 kcal. Let an AI calorie tracker write the quick first pass, then give it your grams to finish the job.
What is an AI calorie counter, and how does it turn a photo into calories?
Whether an app sells itself as a calorie counter AI or an AI calorie tracker, a vision model usually looks at the picture. The calories themselves should come from a food database, not from the model’s memory of what a burrito weighs.
A 2022 systematic review of 78 image-based food-recognition studies found the same stages in most systems. They separate the foods on the plate and name each one. Then they estimate volume, calories or nutrients. I count five jobs in the process. Find each food. Name it. Work out what is in it, such as oil, sugar or sauce. Estimate how much there is. Then look it up in a database and multiply.
The first two jobs are what the pictures in app ads show. The last is plain arithmetic. The trouble sits in the middle. Google’s Nutrition5k study puts numbers on it. Its model predicted calories per gram with a mean error of 9.5%. Asked for total calories from the same kind of picture, with no weight given, the error rose to 26.1%. Adding a volume estimate from depth-sensor images brought it back down to 16.5%. Naming the food turns out to be the simple part, and the portion is where the error comes from.
People aren’t better at it. In the same paper, 16 non-nutritionists missed the weight of a plate by 53% on average, and 4 nutritionists missed by 41%. The ten plates were simple: six held one plain ingredient, four held three.
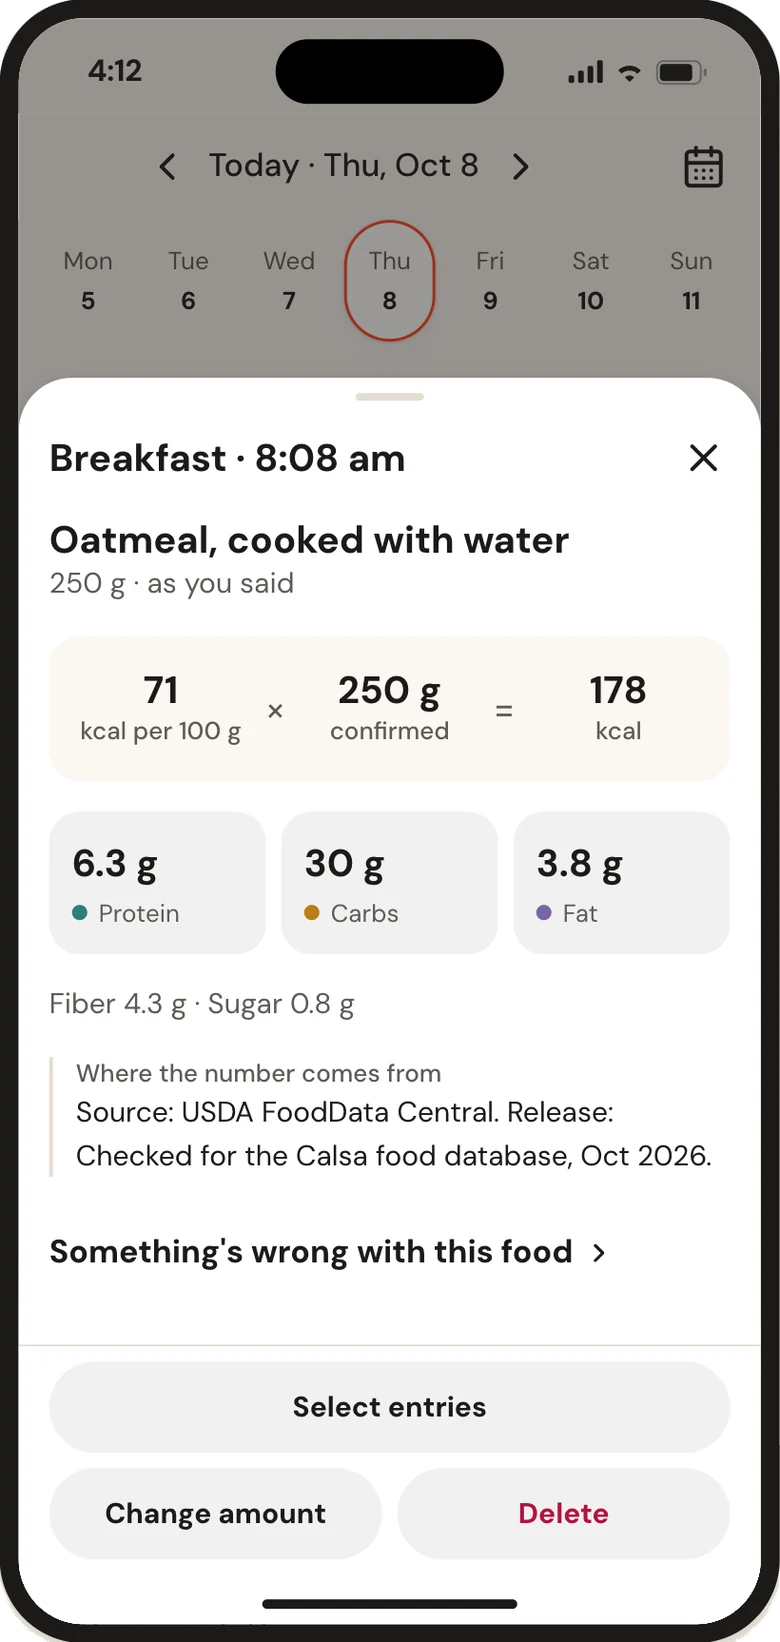
If the app calls your rice couscous, you see it and tap to swap it. If it picks 150 g when you ate 250, nothing looks off. So read the suggested grams before the calories.
Who does the arithmetic: the model or a database?
That design choice matters most, and apps rarely say which one they made. In one design, the model looks at the photo and writes a calorie number itself. In the other, the model only names the foods and suggests grams, and a database turns those into calories.
The second design leaves a step you can check by hand. Say you log a plate in one line. It holds chicken breast 120 g, cooked white rice 200 g, olive oil 13.5 g and raw broccoli 100 g. Each line is grams times the record’s energy per 100 g.
| Ingredient | Grams | kcal per 100 g | Energy | Record |
|---|---|---|---|---|
| Chicken breast, braised | 120 | 166 | 199 kcal | FDC 331960 |
| White rice, cooked | 200 | 130 | 260 kcal | FDC 168878 |
| Olive oil | 13.5 | 884 | 119 kcal | FDC 171413 |
| Broccoli, raw | 100 | 32 | 32 kcal | FDC 321900 |
| Total | 433.5 | 610 kcal |
Skip the oil and the plate reads 491 kcal. That is 119 kcal missing, about a fifth, and no vision model can see a tablespoon of oil soaked into rice. When an app shows you this table, you can fix one gram value and every calorie follows. When it shows only a total, you can’t tell where the number came from, or which gram to fix.
The Nutrition5k split fits this design. Calories per gram, which is a lookup, was the easy part at 9.5% error. Total calories, which needed the portion too, was the hard part at 26.1%. The ChatGPT-5 test fits as well, because its errors fell as the input moved from a picture toward grams.
Watch out for confidence scores. A 2024 study of language and vision-language models found them overconfident most of the time when they state their own uncertainty. A badge that says “92% sure” is decoration unless the app explains how it measured that. I’d rather see an entry marked as an estimate until I confirm the grams than a number that looks sure of itself.
So ask any app where a number comes from. If the reply points to a food record and your grams, you can check it. If it only says “our AI”, there is nothing to check.
How accurate are AI calorie estimates from a photo?
These numbers are fine for an ordinary Tuesday and not fine for a day when the total has to be right. I lined up four recent tests. They use different models, dishes and error measures, so don’t compare rows against each other. Read them as a spread. A separate piece on how close AI food tracker photo estimates get goes through a 2026 NIH test of four photo apps.
First, the measures. They aren’t interchangeable. Mean absolute error is in kcal and tells you the typical miss. Percentage error divides the miss by the true value, so a small snack takes the same miss much harder than a big dinner. A third kind of score counts how often an estimate lands inside a set margin. If an app advertises one score, ask which kind it is.
| Test | Setup | Result |
|---|---|---|
| Fridolfsson et al., 2025 | 52 standardized photos, three models | about 36% average energy error for the two better models, 64.2% to 109.9% for the third |
| ACETADA, 2025 | 806 weighed meal photos, 152 adults, GPT-4o | 165.8 kcal average energy error (24.5%) and 33.4% on portion size |
| Isobe et al., 2026 | 15 hospital meals, 10 AI models and 10 registered dietitians | energy “frequently within ±10%” for the best models, but fat overestimated by more than 20% |
| Rodriguez-Jimenez et al., 2025 | 195 dishes, ChatGPT-5, photo only | 123 kcal average energy error |
The ACETADA meals were cooked, served and weighed in a controlled feeding study in Perth, Australia, so that 24.5% isn’t only an American result. The first study found a pattern worth knowing. All three models underestimated more as the portion grew, with bias slopes from -0.23 to -0.50. A small bowl looks about right. A heaped plate reads light.
In the hospital study, fat went the other way. All ten models overshot it, which the authors call an “invisible nutrient” bias. Fat carries 9 kcal per gram, more than anything else on the plate, and the camera can’t see it.
What does an average error mean over a day? Take a lunch that truly holds 700 kcal. A 24.5% error is 171 kcal, about one and a half tablespoons of olive oil. Some meals will come out high and some low, and those errors partly cancel. A bias, like the underestimate on big portions, doesn’t cancel. It piles up across the week.
These studies come with caveats. They tested general models, not any one app, and apps add their own databases and checks. Many used standardized photos, far easier than a dinner shot under a kitchen light at seven in the evening. Models also change, so a result from 2025 may not hold in 2027.
In these tests photo estimates miss the true energy by roughly a quarter to a third, in both directions. For a lunch you’d otherwise skip logging, that’s a fair trade. For a food you eat every day, use the scale once. A barcode sidesteps the photo problem but not the database behind it, and the best food scanner app piece weighs that trade. The NHS food scanner app shows the other extreme: it rates a scanned product high, medium or low in sugar, salt and fat, and its NHS page describes no food diary or portion sizes. More on photo logging is on one page.
What does a photo miss, and what do grams add?
A photo misses whatever the cook decided. Take a chicken salad. I priced the pieces from USDA records and added the things a camera can’t see.
| Part of the bowl | Amount | Energy | Record |
|---|---|---|---|
| Chicken breast, braised | 120 g | 199 kcal | same record as above |
| Romaine lettuce | 100 g | 17 kcal | FDC 327923 |
| Ranch dressing, one serving | 30 g | 129 kcal | FDC 173592 |
| Ranch dressing, two servings | 60 g | 258 kcal | same record, 430 kcal per 100 g |
| Cheddar, one slice | 28 g | 115 kcal | FDC 170899 |
The visible part, chicken and lettuce, comes to 216 kcal. Add one serving of dressing and a slice of cheddar and the bowl is 460 kcal. Pour two servings of dressing and it’s 589. The three bowls look almost the same. A model sees a salad and picks a number in that range, and you can’t tell which end it picked.
Typing beats the camera here. In the ChatGPT-5 test, the average energy error fell from 123.03 kcal with the photo alone to 92.04 kcal when standard descriptions were added. It fell to 53.33 kcal with an ingredient list that included amounts. Remove the photo and keep only the list, and the error went back up to 66.51 kcal. The best input was both: the picture plus your grams.
The authors also noted that the biggest outliers came from dishes served in bowls, where depth is hard to see. Soup, stew, cereal and rice bowls are the weakest photo cases.
Your bowl isn’t the app’s bowl, either. USDA’s cup of cooked white rice weighs 158 g, which is 205 kcal. If your usual bowl holds 250 g, it’s 325 kcal. An app that assumes the cup undercounts it by 120 kcal every time you eat rice. Weigh your bowl once and it can’t be wrong about that again.
Mixed dishes hide the most: stews, curries, pasta bakes, burritos, sandwiches. The model sees the surface, and you know the recipe. For dishes you cook often, build the recipe once from its ingredients and reuse it, instead of asking a camera to guess it every time.
Speech adds one more step. Your phone turns your voice into text before the app reads it. In a 2024 study, roughly 1% of audio transcriptions from OpenAI’s Whisper, as it stood in 2023, held entire phrases that nobody said. That’s rare. Still, “200 g” and “20 g” differ by a zero, so read the transcript before you save it.
When you photograph a meal, add what only you know: the oil you cooked in, the dressing you poured, any weight you measured.
Is there a free AI calorie counter, and what should you check?
Some apps offer AI scans at no charge, usually with limits, and a free AI calorie counter is worth a trial week. I’d read the listing for three things before putting months of history into it:
- How many AI scans or messages you get, and whether the limit is daily or monthly.
- How long your history stays, and whether you can export it.
- Whether the numbers show a source, so you can check one yourself.
Do the arithmetic on the cap. Three meals and a snack is four scans a day, or 120 in a 30-day month. A cap of 30 a month runs out in the first week.
A scan costs the app money. A free app earns it back with a cap, an upgrade or your data, so check the privacy summary on the store page.
The cheapest test is also the best one. Log one day with the AI, then weigh the same day’s food. If the totals sit within about a fifth of each other, the free tier is doing its job. If they don’t, you’ve learned that for the price of one evening.
How should you use an AI calorie tracker day to day?
Treat it as a draft you correct. Start with the photo, or type the meal in one line with grams. Read the foods and the suggested grams before the calories. Fix the biggest item first, because oil, rice, pasta, meat or cheese usually carry the most. Then add the invisible parts as their own lines, such as dressing, butter or cooking oil, and save.
Weigh your top ten foods one time: cooked rice, pasta, oats, bread, chicken, cheese, nuts, peanut butter, oil and milk are good candidates. After that, the app’s suggestions for those foods can be checked at a glance, and your eye gets better for the rest, because you now know what your usual rice portion looks like on your own plate. That shrinks the portion error without a scale at every meal.
If you cook the same dinners every week, save each one as a recipe once. Then logging takes a tap, and the grams were checked at home, where the scale sits next to the stove and checking costs you nothing. Re-check once a month, or when you change brands or bowls. A portion that drifts by 20% is a bias, and a bias is the one error that doesn’t average out.
One boundary. If a health condition changes what you can eat, a doctor or a registered dietitian interprets the numbers, not an app.
Calsa names the foods in your photo and suggests grams for you to confirm, and it logs oil or dressing as its own entry.
Questions and answers
How accurate is an AI calorie tracker?
They are close for a rough day and loose for a precise one. In a 2025 test on 52 photos, the better models averaged about 36% error on energy, and an ACETADA test of 806 meal photos found 24.5% for GPT-4o. Errors shrink when you add ingredient grams.
Is there a free AI calorie tracker?
Some apps offer AI scans at no charge, usually with a limit on scans or messages. Before you rely on one, check the limit, how long your history is kept, whether you can export it, and whether each number shows its source.
Can an AI calorie counter handle soup, stew or a salad?
Badly, because the camera can't see what's under the surface or in the dressing. In one test, the largest errors came from dishes served in bowls. A chicken salad is 216 kcal as photographed and 589 kcal with two servings of ranch dressing and a slice of cheddar.
Do I still need to weigh my food with an AI calorie tracker?
Weigh the foods you eat most often once, not every meal. Portion size is the hard part: the Nutrition5k model had 9.5% error per gram but 26.1% on total calories. Once you know what your usual portions weigh, you can check the app's suggestions at a glance.
Sources
- Rodriguez-Jimenez M, et al. Image-Based Dietary Energy and Macronutrients Estimation with ChatGPT-5: Cross-Source Evaluation Across Escalating Context Scenarios. Nutrients 2025, Nutrients
- Dalakleidi KV, et al. Applying Image-Based Food-Recognition Systems on Dietary Assessment: A Systematic Review. Adv Nutr 2022, Advances in Nutrition
- Thames Q, et al. Nutrition5k: Towards Automatic Nutritional Understanding of Generic Food. CVPR 2021, arXiv
- Fridolfsson J, et al. Performance Evaluation of 3 Large Language Models for Nutritional Content Estimation from Food Images. Curr Dev Nutr 2025, Current Developments in Nutrition
- Coburn B, et al. Comprehensive Evaluation of Large Multimodal Models for Nutrition Analysis: A New Benchmark Enriched with Contextual Metadata (ACETADA). arXiv 2507.07048, v2 October 2025, arXiv
- Isobe T, et al. Accuracy of AI-Based Nutrient Estimation from Standardized Hospital Meal Images: A Comparison with Registered Dietitians. Nutrients 2026, Nutrients
- Rice, white, long-grain, regular, enriched, cooked (SR Legacy, FDC ID 168878), USDA FoodData Central
- Oil, olive, salad or cooking (SR Legacy, FDC ID 171413), USDA FoodData Central
- Broccoli, raw (Foundation, FDC ID 321900), USDA FoodData Central
- Chicken, broiler or fryers, breast, skinless, boneless, meat only, cooked, braised (Foundation, FDC ID 331960), USDA FoodData Central
- Lettuce, cos or romaine, raw (Foundation, FDC ID 327923), USDA FoodData Central
- Salad dressing, ranch dressing, regular (SR Legacy, FDC ID 173592), USDA FoodData Central
- Cheese, cheddar, sharp, sliced (SR Legacy, FDC ID 170899), USDA FoodData Central
- Groot T, Valdenegro-Toro M. Overconfidence is Key: Verbalized Uncertainty Evaluation in Large Language and Vision-Language Models. arXiv 2405.02917, 2024, arXiv
- Koenecke A, et al. Careless Whisper: Speech-to-Text Hallucination Harms. FAccT 2024 (arXiv 2402.08021, v2 May 2024), arXiv