Food Scanner Apps: Barcodes, Photos and Where Each One Slips
A barcode scan is only as good as the record behind it, and a photo scan misses the portion: GPT-4o's portion error was 33.4% on 806 meal photos. Pick the scan type before the app.
Key takeaways
- A barcode holds an identifying number, so a barcode scan is only as good as the database record behind it.
- In a UK study of 903 supermarket pizzas, 10.8% changed formulation within six months and 29.9% were discontinued or new.
- US rules let a packaged food's calories run up to 20 percent above the label before it counts as misbranded.
- If an app logs a 379 kcal per 100 g line as one 40 g serving of oats, the entry is 227 kcal too high.
- On 806 weighed meal photos, GPT-4o's average energy error was 24.5% and its portion error 33.4%.
No single food scanner app covers everything, so start with what you point it at. A barcode pins down the packet in your hand and is useless for a salad. A photo handles the salad. The portion is its weak spot. In a 2025 test on 806 meal photos, GPT-4o’s portion error was 33.4%. I settle the scan type before I download anything.
What is a food scanner app, and what does it scan?
Some scanners, like the NHS food scanner app, grade products on sugar, salt or additives instead, and this article leaves those out. The ones covered here log what you eat, and underneath they read one of three things: a barcode, a nutrition label or a photo of the food.
Strictly, a barcode carries a number and no nutrition facts at all. GS1, the body that runs the system, describes the GTIN as a code a company uses to uniquely identify its trade items. The app sends that number to a database, and the database sends back a record, which may be right, stale or missing. A barcode scan is only as good as that record.
Label and photo scans work differently. A label scan photographs the panel and reads the digits off it. A photo scan looks at the food itself and guesses. Barcodes and labels exist only on packaged food, so for a plate you cooked, the photo is the only option.
Before you compare apps, list the five foods you log most. If four of them have a barcode, a barcode scanner will do most of the work. If it’s one in five, scanning may not be the habit that sticks, and the food journal apps piece covers apps built around typing instead.
Where does a barcode scan slip?
In four places, and none of them is the scanning. I’d check each one on any app you try.
The first is a missing product. A scanner can only look up what someone entered. The Australian FoodSwitch app launched on a database of 17,000 packaged foods, and its users later added nutrition information for more than 30,000 further products. That is a real gap. If your app says “not found,” use a label scan or type the numbers in.
Second, a stale record. Recipes change. A UK study followed 903 pizzas on supermarket websites for six months, and 10.8% changed their formulation while 29.9% were discontinued or new. A record built last spring may not describe the packet in your hand. When the app shows a last-updated date, read it.
Third, the label has room in it. In the US, a food is misbranded only if its calories run more than 20 percent over the declared value. A packet that says 400 kcal can hold 480, and no scanner can fix that or should claim to.
Fourth, the serving may not match what you ate. This one catches people every week. US labels give every nutrient for a serving, and the FDA tells shoppers to check the servings per container. Its sample label shows 280 calories a serving, so a package of four servings is 1,120. UK labels use a different base. The NHS says nutrition information is per 100 grams or per 100 millilitres, and sometimes per portion. Here is how the two bases go wrong. Rolled oats have 379 kcal per 100 g in USDA’s record. A 40 g bowl is 152 kcal. If an app logs the per-100 g line as one serving, you record 379 kcal for the bowl, which is 227 kcal too many.
The remedy is dull and it works. Compare the app’s kcal per 100 g with the panel on the pack, then look at the grams on the entry before you save it.
What does a per-100 g mix-up cost on other foods?
Oats are the gentle case. A bowl is small, and the food is only moderately dense. Foods you measure with a spoon cost far more when the slip hits them. Each record below is logged correctly first, then as if its per-100 g line were one serving. The records are USDA’s for rolled oats, olive oil, chunk-style peanut butter, sharp cheddar and wheat bread. Servings are USDA’s household portions. The oats keep the 40 g bowl from above.
| Food | kcal per 100 g | Serving | Correct entry (kcal) | Per-100 g line logged as the serving (kcal) | Too high by (kcal) |
|---|---|---|---|---|---|
| Rolled oats, dry | 379 | 40 g | 152 | 379 | 227 |
| Olive oil | 884 | 1 tbsp, 13.5 g | 119 | 884 | 765 |
| Peanut butter, chunk style | 589 | 2 tbsp, 32 g | 188 | 589 | 401 |
| Cheddar, sharp, sliced | 410 | 1 slice, 28 g | 115 | 410 | 295 |
| Wheat bread | 274 | 1 slice, 29 g | 79 | 274 | 195 |
The multiplier is 100 divided by the serving in grams: 2.5 for the oats and 7.4 for the oil. Spoon foods hurt most. The 765 kcal error on the oil is about four times the correct 188 kcal peanut butter entry. That is one number in one field. On anything I measure with a spoon, I read the grams field first.
What if an app reads kilojoules as kilocalories?
Labels that print both units give a scanner a choice. The NHS says UK labels must show energy in kilojoules and kilocalories. One kilocalorie is 4.184 kilojoules, so the oats’ 379 kcal per 100 g sit beside 1,586 kJ. A scanner that takes the kilojoule figure for calories logs 634 kcal for the 40 g bowl instead of 152. The other way round, an entry comes out about four times too low. Compare each new entry with a food you already know, because a gap of about four times points to a unit slip.
Why can two apps show different numbers for the same food?
Each one builds its own database, and the builds differ. In a 2018 test, a researcher entered thirty 24-hour dietary recalls into five popular free tracking apps and into research software. Correlations for energy and macronutrients ran from 0.73 to 0.96. Every app came out significantly lower than the research software on at least one nutrient. The authors say consumers entering their own foods still need testing. I read the result as a warning about databases and don’t use it to rank apps. When a barcode returns two near-identical entries, I take the one that names its source and matches the panel. Why calorie trackers disagree goes through the other causes.
Where does a photo scan slip?
On the portion, and on anything the camera can’t see. A model can often name a food. It can’t know how much oil went into the pan or how deep the bowl is. The same ACETADA test, in which 152 adults ate weighed meals, found a 24.5% average energy error next to the 33.4% portion error.
Your own eye isn’t a better judge. In Google’s Nutrition5k study, 16 non-nutritionists missed the weight of a plate by an average of 53%, and 4 nutritionists missed by 41%. Guessing portions is hard for everyone, and AI food tracker photo estimates tend to land low for that reason.
Photo scans suit two jobs, and the AI calorie counter guide explains how they turn a picture into numbers. One is the plate with no barcode, such as a restaurant dinner or a home-cooked stew. The other is the quick draft when you’d otherwise skip logging. They don’t suit foods you eat every day. A scale beats a camera there.
If your app lets you add grams after the photo, add them. In one 2025 test, ingredient amounts cut ChatGPT-5’s average energy error from 123 kcal to 53 kcal. That is less than half.
How do you fix a photo scan with a scale?
Treat the photo as a draft and rebuild the dense parts from grams. Say the plate holds 120 g of cooked chicken breast and a cup of cooked white rice at 158 g. A tablespoon of olive oil went into the pan. USDA gives 166 kcal per 100 g for braised, skinless chicken breast, 130 for cooked white rice and 884 for olive oil. That makes 199 kcal of chicken, 205 of rice and 119 of oil, 523 kcal for the plate.
The camera sees the chicken and the rice and cannot see the oil. Leave the oil line out and the plate reads 404 kcal, which is 119 short, or 23%. The portion adds a second error. In a 2025 test on 52 standardized photos, all three models read large portions low. The two better ones had a 35.8% average energy error. At the 33.4% portion error from the first test, that cup of rice would be off by about 53 g, or 69 kcal.
A measuring cup won’t rescue the guess. In a 2017 experiment, adults estimated the portions of 17 foods. Those using a household cup as a guide missed by a median of 87.7%, and those guessing the weight with no aid missed by 23.5%. Here is the order I follow when a photo scan is all I have:
- Let the app name the foods.
- Overwrite its amounts for rice, meat and cheese with grams from a scale.
- Add oil, butter and dressing as separate lines, measured with the spoon you used.
- Save the plate as a meal, so the next one starts from your grams.
Should you scan the nutrition label instead?
When the barcode isn’t found, yes. A label scan reads the panel on that exact packet, so it sidesteps a stale or missing record. It carries the label’s own tolerance, though, and it adds a risk of its own. The app can misread a digit, or it can pick the per-100 g column when you wanted the serving.
Read what the app captured before you save. Does the energy match the panel, and does the serving match the amount you ate? Two checks, five seconds.
Loose produce needs separate handling. An apple or a banana has no barcode, so no scanner will find it. Search for it by name and weigh it. A banana of 115 g is 101 kcal at 88 kcal per 100 g.
Which scan fits which food?
| What you’re logging | Scan that fits | Where it slips | What to do |
|---|---|---|---|
| Packaged food | Barcode | missing, stale or wrong record | check the grams and the serving |
| Packaged food, no barcode match | Label photo | misread digit, wrong column | compare with the panel |
| Loose fruit and vegetables | None; search and weigh | no code to scan | weigh and pick the raw record |
| Restaurant plate | Photo | portion, hidden oil | add the oil and sauce as extra lines |
| Home-cooked mixed dish | Recipe from ingredients | photo can’t see inside | build the dish once from grams |
Find the row you eat most. That’s the scan to test first.
Foods you eat most days don’t need a scan every time. I scan a packet once, check the grams against the panel and save it as my own food, because a second scan buys nothing. How to weigh food covers the weighing side of that.
What should you check before you trust a scanner, free or paid?
Some apps scan at no charge, and a free scan is worth a trial week. A scan costs the app a database to maintain and, for photos, a model to run. A free tier usually pays for that with caps or upgrades, so read the listing before you scan your first meal.
Then run a ten-minute test. Scan five things from your cupboard and compare each result with the label on the pack. Count the misses, too. If two of your five items come back as not found, the app’s database is thin for your shops. You’ll be typing a lot, which is reason enough to move on after a week.
Here is how I split the ten minutes. Each row says what a pass looks like, so you aren’t judging by feel.
| Minutes | What you do | It passes if |
|---|---|---|
| 0–2 | Scan five packs: one you buy weekly, one from a small brand or an import, one whose recipe you know has changed | The per-100 g energy equals the panel, and the serving is stated in grams |
| 2–4 | On each hit, change the serving to the grams you would actually eat | The calories scale with the grams instead of staying fixed |
| 4–6 | Scan a pack the app is unlikely to have, such as one from a market stall, then try the label photo | The app says not found, offers the label or manual entry, and the read-back matches the panel |
| 6–8 | Photograph a plate you cooked, then enter the grams | The result is marked as an estimate and changes when you add the grams |
| 8–10 | Look for report-a-record, the source of each number and what the free version caps | Each is findable in under a minute |
Fail the first two rows and I delete the app. The rest can be worked around with a label photo or a scale, but a wrong record and a serving you can’t change cannot. I score each app on five points:
- The app tells you where each number comes from, not just the total.
- It shows the serving and the grams, and lets you change them.
- It handles “not found” with a label scan or a manual entry.
- You can report a wrong record.
- Photo results stay marked as estimates until you confirm the amount.
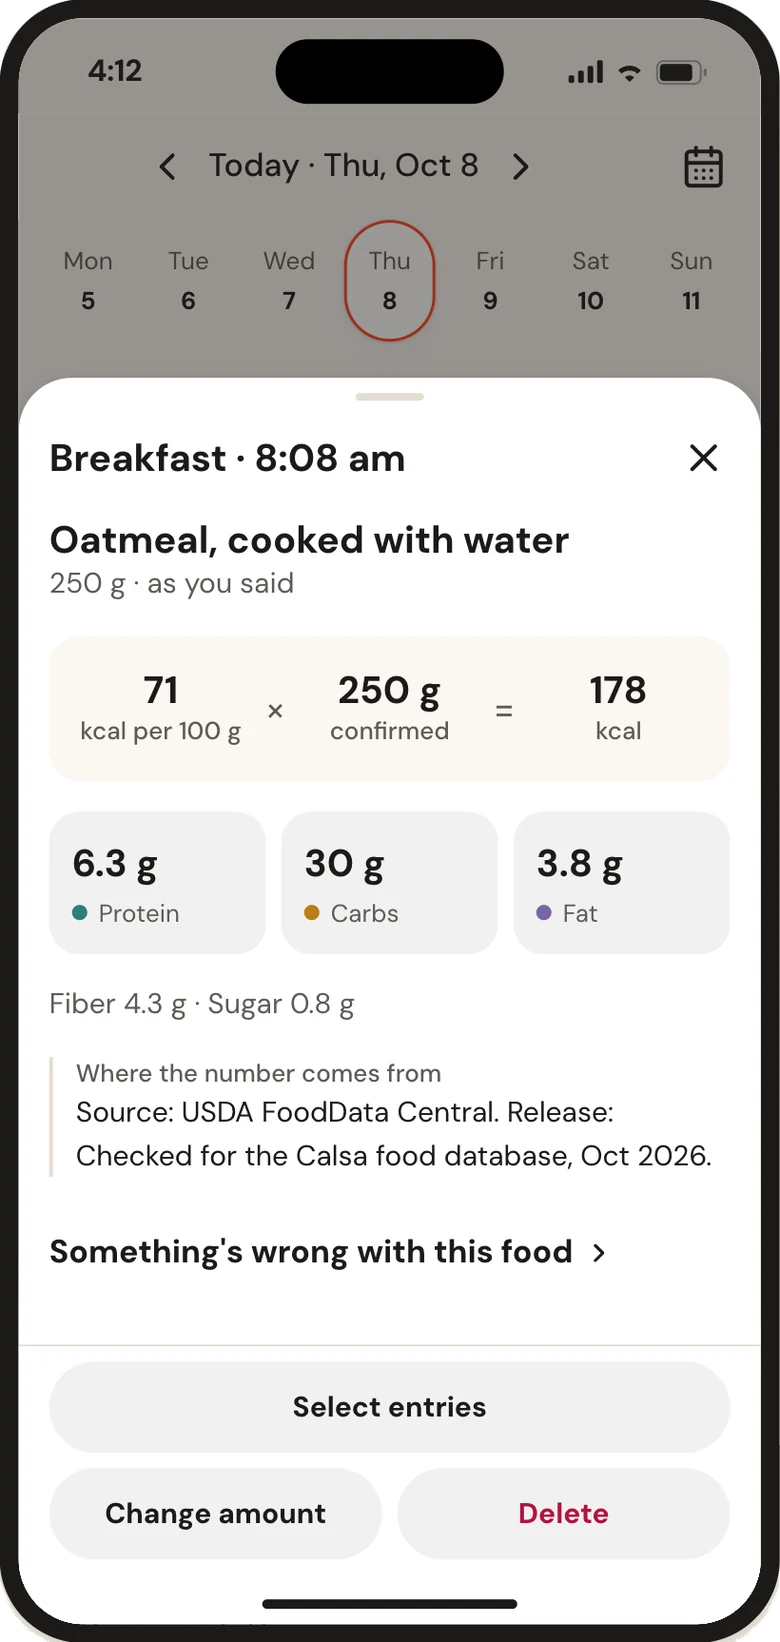
Calsa scans barcodes, UK and Australian products included, and lets you photograph the nutrition label when a barcode isn’t found.
Questions and answers
Is a barcode scanner more accurate than a photo calorie scanner?
For packaged food, usually yes, because it reads the record for that exact product instead of guessing from pixels. It still depends on the record: in one UK study 10.8% of 903 pizzas changed formulation in six months. For a plate with no barcode, a photo is the only scan that works.
Why does my food scanner say product not found?
The database has no record for that barcode. Databases only hold what someone entered, and one Australian app added nutrition information for more than 30,000 products through user submissions after launch. Photograph the nutrition label, or enter the numbers by hand.
Can I scan food for calories for free?
Some apps scan at no charge, usually with limits on scans or history. Scan five items from your cupboard and compare each result with its label. Check how many scans you get, how long history stays and whether each number shows a source.
Do fruit and vegetables have a barcode to scan?
Loose produce has none. Search for it by name and weigh it. A 115 g banana is 101 kcal at 88 kcal per 100 g, and a photo scan adds guesswork that a scale does not.
Why does my scanned food show four times too many calories?
Most often the app read the kilojoule figure as kilocalories, or logged a per-100 g line as one serving. One kilocalorie is 4.184 kilojoules, so a 40 g bowl of oats that is 152 kcal logs as 634 if the wrong column is read. Compare the entry with a food you know and check the unit beside the number.
Sources
- Coburn B, et al. Comprehensive Evaluation of Large Multimodal Models for Nutrition Analysis: A New Benchmark Enriched with Contextual Metadata (ACETADA). arXiv 2507.07048, v2 October 2025, arXiv
- Rodriguez-Jimenez M, et al. Image-Based Dietary Energy and Macronutrients Estimation with ChatGPT-5: Cross-Source Evaluation Across Escalating Context Scenarios. Nutrients 2025, Nutrients
- Thames Q, et al. Nutrition5k: Towards Automatic Nutritional Understanding of Generic Food. CVPR 2021, arXiv
- Global Trade Item Number (GTIN), GS1
- Dunford E, et al. FoodSwitch: A Mobile Phone App to Enable Consumers to Make Healthier Food Choices and Crowdsourcing of National Food Composition Data. JMIR mHealth and uHealth 2014, JMIR mHealth and uHealth
- Harrington RA, et al. Nutrient composition databases in the age of big data: foodDB, a comprehensive, real-time database infrastructure. BMJ Open 2019, BMJ Open
- 21 CFR 101.9 Nutrition labeling of food, paragraph (g)(5), U.S. Code of Federal Regulations (eCFR)
- How to Understand and Use the Nutrition Facts Label, U.S. Food and Drug Administration
- How to read food labels, NHS
- Cereals, oats, regular and quick, not fortified, dry (SR Legacy, FDC ID 173904), USDA FoodData Central
- Bananas, ripe and slightly ripe, raw (Foundation, FDC ID 1105314), USDA FoodData Central
- Oil, olive, salad or cooking (SR Legacy, FDC ID 171413), USDA FoodData Central
- Peanut butter, chunk style, with salt (SR Legacy, FDC ID 174265), USDA FoodData Central
- Cheese, cheddar, sharp, sliced (SR Legacy, FDC ID 170899), USDA FoodData Central
- Bread, wheat (SR Legacy, FDC ID 172686), USDA FoodData Central
- Food energy: methods of analysis and conversion factors (FAO Food and Nutrition Paper 77), Food and Agriculture Organization of the United Nations
- Griffiths C, Harnack L, Pereira MA. Assessment of the accuracy of nutrient calculations of five popular nutrition tracking applications. Public Health Nutr 2018, Public Health Nutrition
- Chicken, broiler or fryers, breast, skinless, boneless, meat only, cooked, braised (Foundation, FDC ID 331960), USDA FoodData Central
- Rice, white, long-grain, regular, enriched, cooked (SR Legacy, FDC ID 168878), USDA FoodData Central
- Fridolfsson J, et al. Performance Evaluation of 3 Large Language Models for Nutritional Content Estimation from Food Images. Curr Dev Nutr 2025, Current Developments in Nutrition
- Bucher T, et al. The international food unit: a new measurement aid that can improve portion size estimation. Int J Behav Nutr Phys Act 2017, International Journal of Behavioral Nutrition and Physical Activity