AI Food Tracker Photo Estimates: How Close Do They Get?
Photo calorie estimates usually land low. In a 2026 NIH test of four photo apps on 102 prepared meals, the average shortfall was 252–345 kcal per meal, about a third.
Key takeaways
- In a 2026 NIH test, four photo apps ran 252–345 kcal under on meals that averaged 918 kcal.
- A review of 52 studies found average calorie error from 0.10% to 38.3%, lower for single, simple foods.
- One tablespoon of olive oil is 119 kcal, 21% of a 578 kcal plate, and it does not show in a photo.
- In 15 hospital meals, dietitians landed within ±10% on energy 86.7% of the time, against 73.3% for the best AI model.
- Confirm the grams, log oil on its own line, and take calories from a database record.
An AI food tracker that reads a photo usually reads the plate low. In a 2026 NIH test of four photo apps, the average shortfall was 252–345 kcal per meal, about a third. The figure comes from a conference abstract on 102 meals from a controlled feeding study, so it is preliminary. Other studies find smaller gaps on simple plates and bigger ones on mixed dishes.
How close do photo calorie estimates get?
Five tests are below, from the widest view to the narrowest, and in each of them the gap shrinks as the food gets simpler.
| Study | What was tested | Result |
|---|---|---|
| Shonkoff et al., 2023 | Review of 52 studies of automated photo-based dietary assessment | Average calorie error from 0.10% to 38.3%, lower for single, simple foods |
| Thames et al., 2021 | A research model trained on a 5,066-dish set, tested on the held-out tenth | 70.6 kcal off on average, 26.1% of the mean dish |
| Fridolfsson et al., 2025 | Three general-purpose AI models on 52 photos of weighed food | 35.8% energy error for the best-performing models, and every model read large portions low |
| Isobe et al., 2026 | 15 hospital meals, 10 dietitians against AI models | 73.3% of energy estimates within ±10% for the best model, 86.7% for dietitians (its Table 2) |
| Charles et al., 2026 | Photo features of four calorie apps on 102 prepared meals averaging 918 kcal | 252–345 kcal too low per meal, about a third |
The Thames model is a research system, not an app you can download. I include it because it shows what a photo alone can do when the model is built for the job. Even there, the error is about a quarter of the calories. Plain plates fare best.
Isobe’s row shows the other side. The best general model did well, and the dietitians did better: a mean absolute energy error of 22.4 kcal against 38.5 kcal for the model.
Pick one meal you eat every week. Weigh it. Then compare the total with a photo estimate of the same plate. That tells you more about your own food than any average in the table.
Why does a photo miss calories?
A photo shows the surface of the food, not its weight and not what was cooked into it. Two things go missing: grams, and fat. Here is one plate, worked out from USDA records. The photo shows rice and chicken, and it does not show the oil that went into the pan.
| Ingredient | Grams | kcal per 100 g | Energy |
|---|---|---|---|
| Rice, white, medium-grain, enriched, cooked | 200 g | 130 kcal | 260 kcal |
| Chicken breast, braised | 120 g | 166 kcal | 199 kcal |
| Olive oil | 13.5 g (1 tablespoon) | 884 kcal | 119 kcal |
| Total | 333.5 g | 578 kcal |
Leave out the oil and the plate is 459 kcal, so the tablespoon adds 119 kcal, which is 21% of the meal. Nothing in the picture gives it away. You can’t weigh what you can’t see.
Portion size does the same damage: the rice record lists one cup as 186 g, which is 242 kcal at 130 kcal per 100 g. Heap the cup to 240 g and it is 312 kcal, yet from above a level cup and a heaped one look alike. The difference is 70 kcal.
Fat is where the studies disagree most. The NIH apps read fat about 30 g low per meal. In the hospital study every AI model overestimated lipids instead, with a mean bias above 20%. The authors call fat an invisible nutrient. Which way the error points depends on the tool.
Next time you log a stir-fry or a salad, add the oil or dressing as its own line and weigh it. That’s ten seconds for 119 kcal in the plate above.
Soups and stews hide it on a larger scale, because the camera sees one brown surface. For those I’d log the recipe by ingredient. No picture beats that, and the grams stay yours. For packaged food a barcode sidesteps the guessing: food scanner apps compares where each scan type slips, and the NHS Food Scanner app shows what a barcode rating looks like without a diary.
Is a photo estimate better than eyeballing the plate?
On the evidence above it is about as good as a careful look, and much faster. It is not a measurement.
The Nutrition5k team ran its own human test. Four nutritionists and 16 other people estimated ingredient weights from 10 deliberately simple photos, with a US quarter and a phone named as size references. The nutritionists were off by 41% on average, the others by 53% (Thames et al.). The 52-study review says AI methods line up with human estimates and could beat them. The NIH group says its one-third shortfall resembles what self-reported diet records show.
A photo holds up against a careful guess. A scale beats both. A wrist won’t do better either, since a calorie counter watch estimates what you burn and not what you eat. I treat a photo as a ten-second first draft. Then I fix the items that carry the calories, which means the grams of the biggest item and any oil.
How do I get a closer estimate from an AI food tracker?
Give the model more than the picture, and take the calories from a database, not from the model. A study of 195 dishes showed the effect with ChatGPT-5: the estimates improved as the researchers added standardized descriptions, then ingredient lists with amounts. They got worse when the image was removed (Rodríguez-Jiménez et al., 2025). The words counted too. The guide to AI calorie counters covers what else to check in one.
These five habits close the gaps above, and each takes under a minute:
- Check the grams of the biggest item before you save the entry, since that one number moves the total most.
- Log oil, butter, sauce and dressing as separate lines.
- Name the dish when the camera can’t tell, such as “lentil soup with coconut milk”.
- Make sure the calories come from a database record for those grams.
- Weigh your three most common meals once and reuse them.
A word on limits. Fridolfsson and colleagues conclude that general models are not yet suitable where intake must be exact, such as clinical or athletic use. If a doctor or coach needs your real numbers, weigh the food.
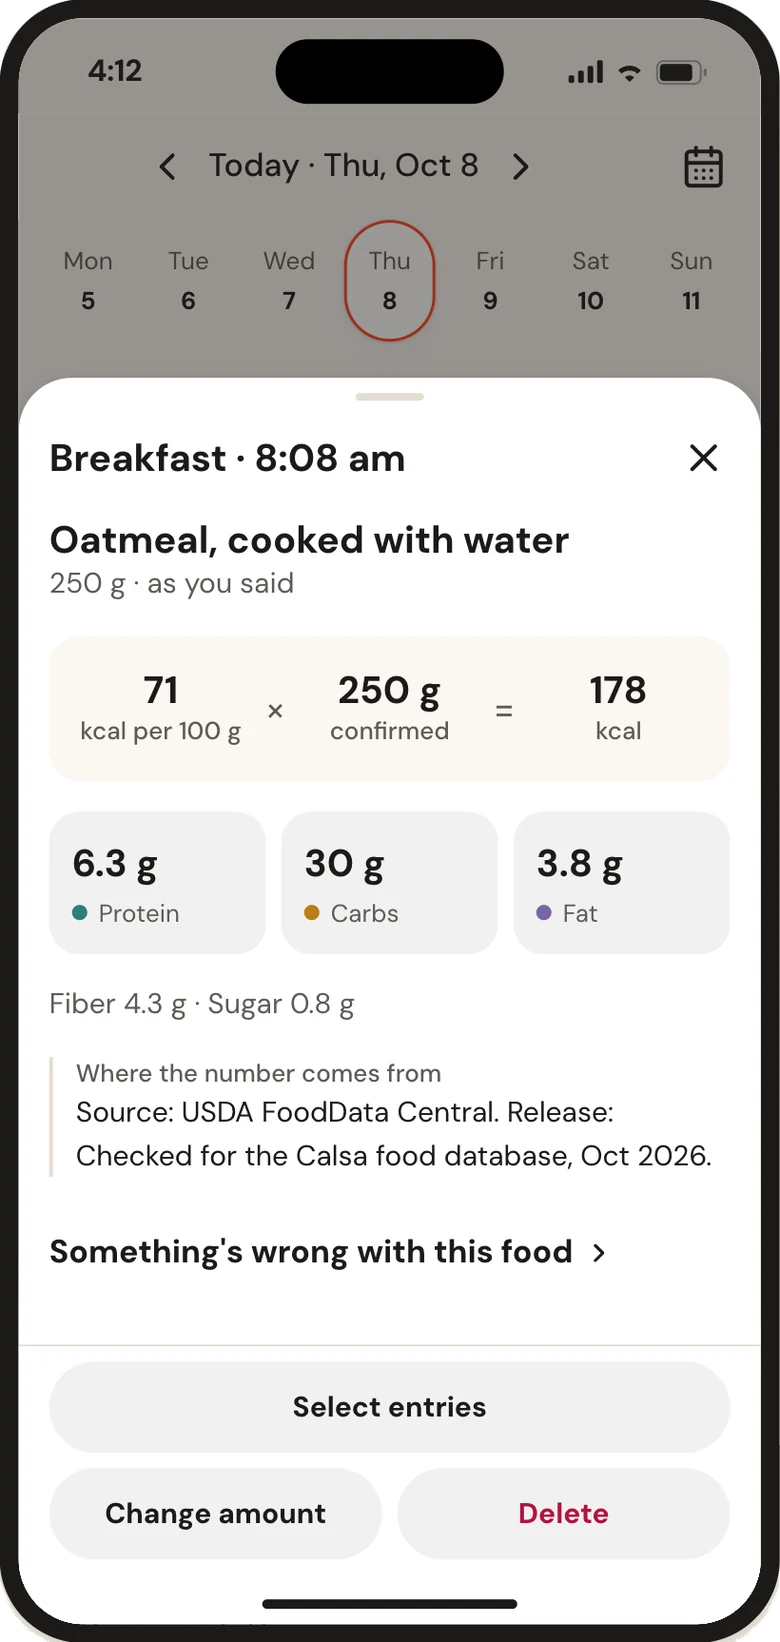
In Calsa, a photo gets you the foods named and grams suggested for you to confirm, with oil and dressing on a line of their own.
Questions and answers
How accurate are photo calorie counters?
On mixed meals, expect a quarter to a third off. In a 2026 NIH test the average shortfall was 252–345 kcal per meal, about a third, on meals averaging 918 kcal. A single plain food comes out much closer.
Why do photo calorie apps underestimate fat?
Fat hides in oil, butter and sauce, and none of it shows in a picture. The NIH apps read fat about 30 g low per meal. One tablespoon of olive oil alone is 119 kcal.
Does describing the meal improve a photo calorie estimate?
Yes. In a study of 195 dishes, error shrank as standardized descriptions and then ingredient lists with amounts were added. It grew when the photo was removed, so the picture and the words both count.
What should I do if my log says I am eating less but my weight is flat?
Suspect the log first. Photo estimates lean low, and oil is a likely gap. Weigh the three biggest items in your meals for a week, add the cooking fat as its own line, and compare again against your two-week weight trend.
Sources
- Charles O, Hengist A, et al. Photograph-based AI Features in Calorie-tracking Apps Underestimate Energy Content of Meals. Abstract, NUTRITION 2026, American Society for Nutrition, NUTRITION 2026
- Shonkoff E, et al. AI-based digital image dietary assessment methods compared to humans and ground truth: a systematic review. Ann Med 2023, Annals of Medicine
- Thames Q, et al. Nutrition5k: Towards Automatic Nutritional Understanding of Generic Food. CVPR 2021, arXiv
- Fridolfsson J, et al. Performance Evaluation of 3 Large Language Models for Nutritional Content Estimation from Food Images. Curr Dev Nutr 2025, Current Developments in Nutrition
- Isobe T, et al. Accuracy of AI-Based Nutrient Estimation from Standardized Hospital Meal Images: A Comparison with Registered Dietitians. Nutrients 2026, Nutrients
- Rice, white, medium-grain, enriched, cooked (SR Legacy, FDC ID 168880), USDA FoodData Central
- Chicken, broiler or fryers, breast, skinless, boneless, meat only, cooked, braised (Foundation, FDC ID 331960), USDA FoodData Central
- Oil, olive, salad or cooking (SR Legacy, FDC ID 171413), USDA FoodData Central
- Rodríguez-Jiménez M, et al. Image-Based Dietary Energy and Macronutrients Estimation with ChatGPT-5. Nutrients 2025, Nutrients