Cal AI Reviews: What Users Praise and What They Report
Of the 500 newest US App Store reviews, 252 gave one or two stars, and billing is the most common complaint. In an NIH test of 102 meals, the app's photo estimates averaged 345 kcal below the true energy.
Key takeaways
- Of the 500 newest US App Store reviews, 252 gave one or two stars and 196 gave four or five.
- Among the low reviews, 132 mention a subscription, trial, paywall, price or paying, and 44 mention accuracy.
- In an NIH test of 102 meals, the app's photo estimates averaged 345 kcal below the true figure, on meals averaging 918 kcal.
- The maker's FAQ says the app is about 80% accurate and doesn't say what that percentage measures.
- The NIH result is a conference abstract, so it counts as preliminary until a peer-reviewed journal publishes it.
Cal AI reviews split in two. The all-time store score is high. Yet 252 of the 500 newest US App Store reviews gave one or two stars, and billing comes up most. People praise how fast the Cal AI app logs a meal from a photo. An NIH test also found its photo estimates ran low. Below: both sides, and what I’d do about them.
What do Cal AI reviews say overall?
Over the long run the score is 4.8 from 369K ratings on the US App Store listing. The UK, Canadian and Australian listings show 4.7 from 27K, 27K and 18K ratings. For the written side I read the 500 most recent US reviews from Apple’s public reviews feed. They run from 10 June to 8 October.
By stars, 216 gave one star, 36 two, 52 three, 32 four and 164 five. That’s 252 low reviews (50%) against 196 high ones (39%). A star average and a feed of text reviews measure different things, so neither cancels the other.
What do users praise about Cal AI?
Speed, mostly. Of the 196 four- and five-star reviews, 47 use words like “easy”, “fast”, “quick” or “simple”. Another 17 mention the photo or picture, and 8 mention barcodes or labels. Many are short: 54 of the 196 run to ten words or fewer, so don’t expect detail.
The longer ones are more specific. The reviews the US listing shows first praise logging a multi-ingredient meal in one photo instead of many taps. They also like the barcode and nutrition-label options, and the ability to overwrite macros when the database lacks a food. One reviewer found the camera handy at restaurants.
What do users report about Cal AI?
Billing dominates the low reviews. Of the 252, 132 mention a subscription, trial, paywall, price or paying, and 45 mention a charge, a refund, cancelling or billing. Another 21 say they expected a free app. A separate 44 use words like “accurate”, “inaccurate”, “incorrect”, “wrong” or “way off”, and 10 mention portions, servings or grams. Bugs and crashes show up in 12. What the app costs, and what the trial is, I cover in is Cal AI free. For the prices, the trial and cancelling set beside a tracker that shows a source on each entry, there’s Cal AI vs Calsa.
Accuracy comes up in praise too. 11 of the 196 high reviews use the same words, often as a small caveat. One reviewer wrote that sodium, fat and at times fiber were far off once they checked their entries.
I matched keywords and didn’t read each review for intent, so a “wrong” could be about the photo or the price. The counts show which complaints recur, and I wouldn’t stretch them into a ranking.
Is Cal AI accurate? What the NIH test found
In one NIH test, Cal AI and three other photo apps underestimated calories. Researchers at the National Institute of Diabetes and Digestive and Kidney Diseases photographed 102 meals from a metabolic kitchen, where ingredients were weighed to the nearest 0.1 g. They ran the photos through four apps. They presented the abstract at the American Society for Nutrition meeting in July 2026, and the society’s release summarizes it.
| Measure from the abstract | Result |
|---|---|
| Average meal | 918 kcal (range 592–1,211), 61 g fat, 60 g carbs, 36 g protein |
| Cal AI, mean energy error | −345 kcal (95% CI −392 to −296) |
| Cal AI, limits of agreement | −821 to +132 kcal |
| Carbohydrate error, Cal AI | about −14 g |
| Fat error, all four apps | about −30 g |
All four apps underestimated energy, by 252 to 345 kcal. Cal AI’s 345 kcal was the largest of the four, and on a 918 kcal meal it is 38% by my division. The abstract’s pooled figure is about 33%. Carbohydrate estimates were the most consistent, and the consistency of everything else was poor.
The maker’s FAQ says the app is “about 80% accurate”. It doesn’t say what the percentage measures, so I won’t line it up against the NIH figure.
Limits matter here. It’s a conference abstract that hasn’t finished peer review, the meals were standardized photos of prepared dishes, and I can’t see whether anyone adjusted portions. I’d read it as a warning about portions and fat, and I wouldn’t stretch it into a ruling on the whole app. A way to run your own is in how to choose a calorie counter app.
How do you get better numbers from photo logging?
Treat the photo as a first draft, then fix the grams and the fat. The NIH authors say people who don’t adjust portions should treat the results with caution, and that mixing photo tools with traditional methods could help. The NIH authors’ warning is about portions and fat, so my fixes are about grams:
- Weigh the main item once and enter the grams.
- Add oil, butter, dressing and sauce as separate lines. One tablespoon of olive oil is 13.5 g, and at 884 kcal per 100 g that’s about 119 kcal (USDA record).
- Scan the barcode or the nutrition label for packaged food. The FAQ says logging works by photo scan, barcode scan or manual search.
- Shoot in good light with the food in focus, as the FAQ advises.
If photos aren’t your thing, Cal AI vs MyFitnessPal puts the photo app next to a search logger.
A 30 g fat shortfall is 270 kcal at 9 kcal per gram of fat, and that is roughly two tablespoons of olive oil. If you’d rather ask a chat to count than point a camera, AI nutrition coach apps covers what a chat can and can’t count.
How does Calsa handle photo logging?
Calsa’s photo logging is an estimate too, which is why it asks you to confirm the portion, so the row below compares how Calsa and the category treat sources. For the comparison I looked at 15 calorie trackers. All of them are sold in the US, UK, Canada and Australia, and I read their websites, help centers and App Store pages. Paid screens I did not open.
| In the category (of 15 apps, checked 8 Oct 2026) | Calsa | |
|---|---|---|
| Source of each number (DF-01) | 0 of 15 show the database source of every number; 9 show a check badge or a “checked by nutritionists” claim without it | every number shows its source and database release; an unconfirmed amount is marked “estimate” |
| Where Calsa is weaker | a subscription is required, and the photo estimate still needs your confirmation; there is no manual workout logging, no Apple Watch app or widget, no meal plans or fasting, and the food database is smaller | |
| Choose something else if | you want a plan that costs nothing, a watch app or a weekly meal plan |
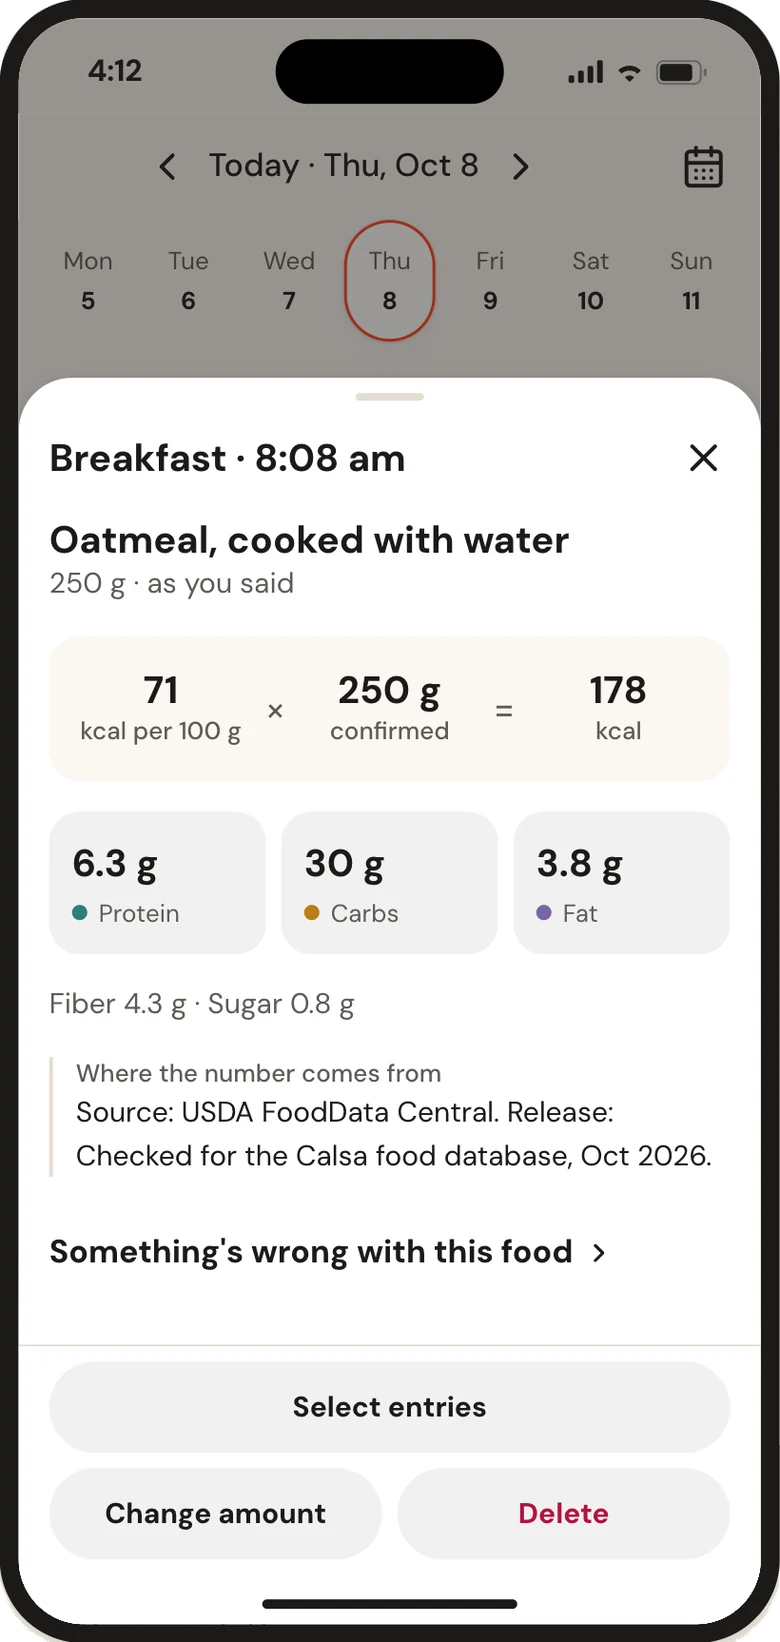
Calsa names the foods in a photo, suggests grams and puts oil and dressing on their own lines, and the portion is yours to confirm.
Questions and answers
Do photo calorie apps underestimate or overestimate?
In one NIH test they underestimated. All four apps came in 252 to 345 kcal below the true energy of 102 prepared meals, and fat was about 30 g low. The result is a conference abstract, so it is preliminary.
Does Cal AI work with barcodes, or only photos?
It also scans barcodes. The maker's FAQ says logging works through photo scan, barcode scan or manual search, and it advises keeping a nutrition label in focus when you scan one.
How many ratings does the Cal AI app have?
The US App Store listing showed 4.8 from 369K ratings. The UK and Canadian listings showed 4.7 from 27K ratings each, and the Australian one 4.7 from 18K.
What do I need to run Cal AI, and can I import my history?
The FAQ lists iOS 18 or higher on iPhone and Android 10 or higher. It also says direct import from MyFitnessPal isn't supported yet, so you start logging from scratch.
Sources
- Cal AI - Calorie Tracker, US App Store listing, Apple App Store (US)
- Cal AI - Calorie Tracker, UK App Store listing, Apple App Store (UK)
- Cal AI - Calorie Tracker, Canadian App Store listing, Apple App Store (Canada)
- Cal AI - Calorie Tracker, Australian App Store listing, Apple App Store (Australia)
- Customer reviews feed for Cal AI, US App Store, most recent first, pages 1 to 10, Apple
- Charles O, Flacke EU, Turner S, et al. Photograph-based AI Features in Calorie-tracking Apps Underestimate Energy Content of Meals (abstract, NUTRITION 2026), NIDDK, National Institutes of Health, presented at the American Society for Nutrition meeting
- Your AI calorie-tracking app may be off by 345 calories (American Society for Nutrition release, 26 July 2026), American Society for Nutrition, via ScienceDaily
- Frequently asked questions (last updated July 2026), Cal AI (Viral Development LLC)
- Oil, olive, salad or cooking (SR Legacy, FDC ID 171413), USDA FoodData Central
- Food energy: methods of analysis and conversion factors, chapter 3, Calculation of the energy content of foods: energy conversion factors, Food and Agriculture Organization of the United Nations