Calorie Tracker Spreadsheet: Build One in Google Sheets
Build three tabs: Foods with energy per 100 g, Log with one row per food, Days with SUMIFS totals. One XLOOKUP formula turns grams into calories: 40 g of rolled oats at 379 kcal per 100 g is 152 kcal.
Key takeaways
- A calorie tracker spreadsheet needs three tabs: Foods (energy per 100 g), Log (one row per food eaten) and Days (totals).
- Calories are the value per 100 g times grams divided by 100, so 40 g of rolled oats at 379 kcal per 100 g is 152 kcal.
- XLOOKUP finds the food in Foods, SUMIFS adds up one date's rows in the Log, and AVERAGE over seven totals gives a weekly figure.
- Weigh 200 g of rice raw and log it against the cooked row, and the sheet shows 260 kcal instead of 730 kcal, a 470 kcal miss.
- A spreadsheet suits a few weeks of learning the arithmetic, because the cost of typing and copying each entry does not fall over time.
A calorie tracker spreadsheet needs three tabs: Foods, Log and Days. Foods lists each food you eat once, Log gets one row per thing eaten, and Days adds each date up. One lookup formula turns grams in the Log into calories, using values per 100 g from USDA records kept in Foods. The formulas follow Google’s help pages, and I checked the sample numbers by hand.
What does a calorie tracker spreadsheet need?
Three tabs, each with one job. Foods holds one number per food. Log holds what you ate, in grams. Days holds the totals. Keeping them apart means a calorie value lives in exactly one cell, so fixing it once fixes every row that uses it.
The rule behind the design is short. Store energy per 100 g, never per serving. A serving column can’t scale to the amount you actually ate, while a per-100 g column can: calories = value × grams ÷ 100.
Treat the three tabs as a calorie tracker template you copy to a fresh file each month. The formulas below are for Google Sheets and follow its function help. If you’d rather start on paper, the food diary template is the same job without formulas.
How do I build the Foods tab?
Make a table with three columns: the food name, its energy per 100 g and the record the number came from. Put it on a tab called Foods, starting in row 2, with headers in row 1.
Here is a starter set. Every number is from a USDA FoodData Central record, with energy by the specific Atwater factors where the record gives them. The state of the food sits in the name, since it changes the number.
| Food | kcal per 100 g | USDA record |
|---|---|---|
| Rice, white, cooked | 130 | 168878 |
| Chicken breast, braised | 166 | 331960 |
| Egg, whole | 147 | 748967 |
| Banana | 88 | 1105314 |
| Oats, rolled, dry | 379 | 2346396 |
| Greek yogurt, nonfat | 61 | 330137 |
| Milk, 2% | 50 | 171267 |
| Wheat bread | 274 | 172686 |
| Broccoli, raw | 32 | 321900 |
| Olive oil | 884 | 171413 |
To add your own foods, take the per-100 g energy from the label or from a record, and paste the record number next to it. Some records give two energy figures. Pick one kind and stick to it, because mixing them is how a sheet drifts without anyone noticing.
Don’t fill the tab with fifty foods on day one. Start with yesterday’s meals. Add each food the first time you eat it, and after two weeks the tab holds what you actually eat.
Last, give the two columns names. Select the food names (A2:A), choose Data, then Named ranges, and call it food_names. Do the same for the energy values (B2:B) and call that food_kcal. Google’s named ranges help allows letters, numbers and the _ character in a name, and no spaces, which is why the names have an _ in them. Named ranges keep the formulas short and stop them shifting when you fill them down.
How do I build the Log tab with XLOOKUP?
Give the Log four columns: date, food, grams and calories. The calories column is one formula that looks the food up in Foods and scales it by grams.
In Log, put dates in column A, food names in column B and grams in column C. In D2, enter this:
=IF(B2="","",ROUND(XLOOKUP(B2,food_names,food_kcal)*C2/100))
XLOOKUP takes a search key, the range to search and the range to return from. Here it finds the food in food_names and returns the matching number from food_kcal. The IF leaves empty rows blank, and ROUND gives whole kcal. Fill the formula down the column.
Make column B a dropdown so you can’t mistype a name. Select the cells in column B, open Data, then Data validation, add a rule, and choose “Dropdown from a range”. Then pick the food names on the Foods tab, as Google’s dropdown instructions describe. If you type a food that isn’t on the Foods tab, column D shows #N/A. That error is useful. It tells you to add the food to Foods before you log it.
Here is a sample day, entered row by row. The formula fills the calories column.
| Date | Food | Grams | kcal |
|---|---|---|---|
| Oct 5 | Oats, rolled, dry | 40 | 152 |
| Oct 5 | Milk, 2% | 150 | 75 |
| Oct 5 | Banana | 115 | 101 |
| Oct 5 | Egg, whole | 100.6 | 148 |
| Oct 5 | Wheat bread | 87 | 238 |
| Oct 5 | Greek yogurt, nonfat | 156 | 95 |
| Oct 5 | Chicken breast, braised | 120 | 199 |
| Oct 5 | Rice, white, cooked | 200 | 260 |
| Oct 5 | Broccoli, raw | 152 | 49 |
| Oct 5 | Olive oil | 13.5 | 119 |
Check one row by hand. For rolled oats, 379 kcal per 100 g × 40 g ÷ 100 = 151.6, which rounds to 152. Any other number means the lookup points at the wrong column.
How do I total each day and get a weekly average?
Use SUMIFS on a Days tab, with one row per date, a total, your target and what’s left. Google’s SUMIFS adds up a range when every condition you give it is met. Here the one condition is a matching date.
First name two more ranges on the Log tab: the dates in A2:A as log_dates and the calories in D2:D as log_kcal. Then put a date in A2 of the Days tab and enter this in B2:
=SUMIFS(log_kcal,log_dates,A2)
That adds every calorie in the Log whose date matches A2. For the sample day above it returns 1,436 kcal. Next, type your target in C2. Use the calorie calculator for it, or the number a clinician gave you. If that target sits below what you burn, the calorie deficit diet article shows how to fit it around foods you already eat. In D2, enter =C2-B2 and you have what’s left. Protein, carbs and fat can get their own columns, laid out in the food tracker template.
For the weekly average, add a row under seven days of totals and enter =AVERAGE(B2:B8). Read that cell rather than any single day. A weekend that runs 600 kcal over moves a seven-day average by about 86 kcal, which is 600 ÷ 7. That’s a better picture of the week than one loud Saturday.
Two details save headaches. Enter dates as real dates, because text dates can fail to match and that day will read 0. A row with no food stays blank, and SUMIFS ignores it.
Where does a spreadsheet tracker break?
At the edges, where you type, add a new food or change a food’s state. A spreadsheet only knows the foods you gave it, and it believes whatever you type.
Food state is the classic trap. Weigh 200 g of rice raw and log it against the cooked row, and the sheet shows 260 kcal. The raw white rice record is 365 kcal per 100 g, so those 200 g are 730 kcal. That is a 470 kcal miss from one missing word in a name, which is why the Foods names carry “cooked”, “raw” and “dry”.
Phones are the next weak point. In my experience, typing a row into Sheets on a phone is slow, and picking from a dropdown of 40 foods is slower. A sheet that lives at your desk gets filled in at night, which is when meals get forgotten.
Then there’s copying. Repeating a day means copying ten rows and changing a date. Fine for a week, tedious for a year. And if what you need is a week of written records for a clinician, a 7-day food diary is the right format, not a spreadsheet.
I’d use a spreadsheet to learn the arithmetic, and as a tracker for a few weeks while you want to watch the numbers move. I wouldn’t trust it for years, because an entry costs the same effort on day 400 as on day 1.
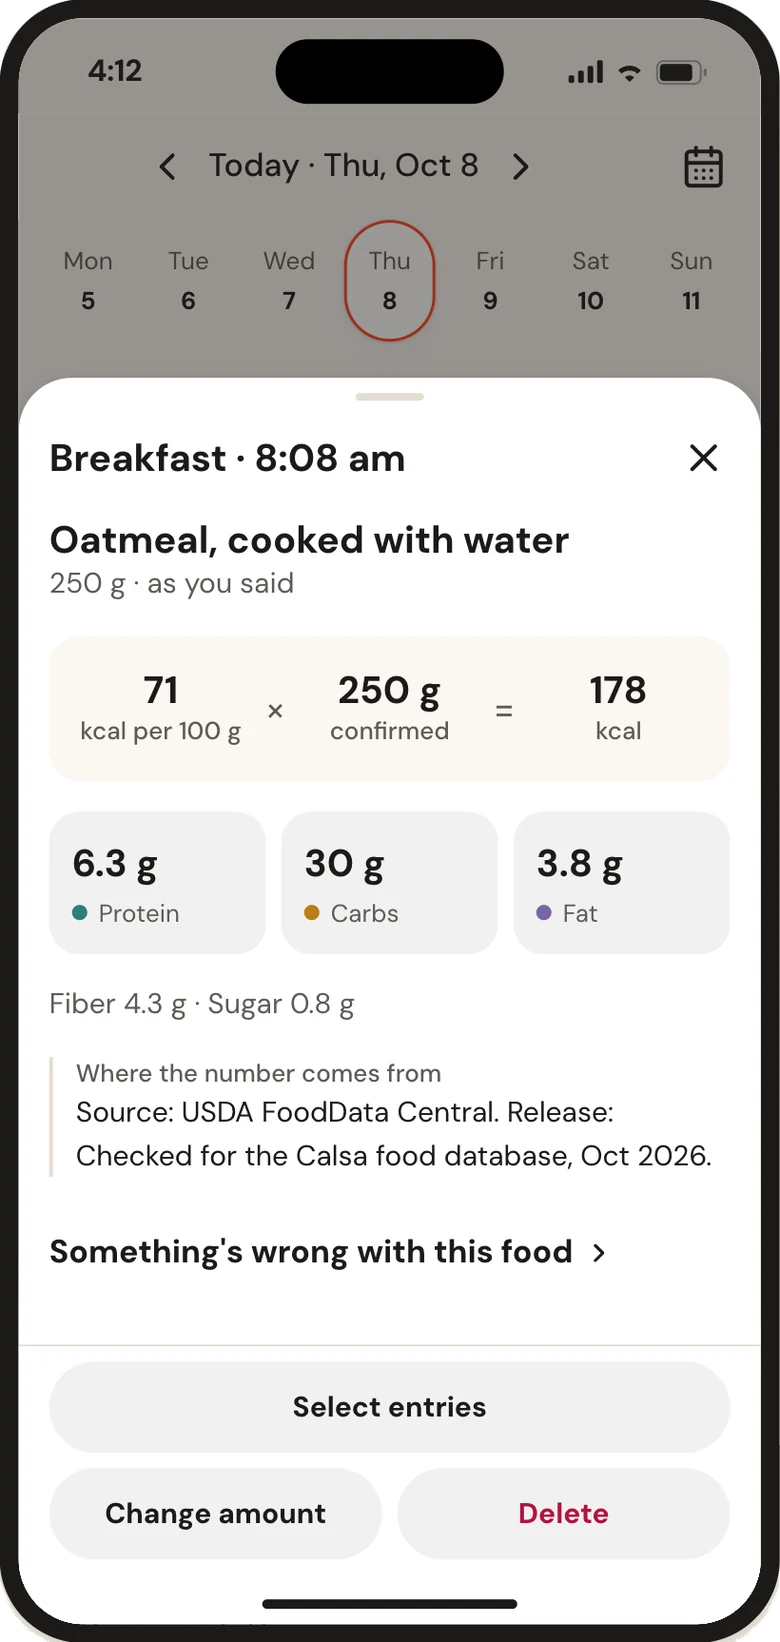
If you outgrow it, Calsa accepts the same entry as one typed line, such as “oatmeal 250 g, banana”. It shows the source and the math behind each number, “per 100 g × grams”. You can also bring your history over from a CSV file, so a sheet exported from Google Sheets doesn’t start your diary from scratch. You match the columns and check a preview before anything is saved.
Questions and answers
How do I make a calorie tracker in Google Sheets?
Make three tabs. Foods lists each food with its energy per 100 g, Log has date, food, grams and a calorie formula, and Days totals each date with SUMIFS. Add your target on the Days tab and the sheet shows what is left.
What formula calculates calories in Google Sheets?
Use XLOOKUP to find the food's energy per 100 g and multiply by grams over 100: =IF(B2="","",ROUND(XLOOKUP(B2,food_names,food_kcal)*C2/100)). For 40 g of rolled oats at 379 kcal per 100 g the result is 152 kcal.
How do I add up calories per day in Google Sheets?
Put each date on the Days tab and use =SUMIFS(log_kcal,log_dates,A2), which adds every calorie in the Log whose date matches. Enter the dates as real dates, because text dates can fail to match and the day will read 0.
Is there a calorie tracker template I can copy instead?
Build the three tabs above once and copy the file each month, which is a calorie tracker template of your own. The Foods tab carries over, so only the Log and Days tabs restart. Keep the record number next to each food so you can check it later.
Is a spreadsheet good enough for tracking calories long term?
It is good for a few weeks and weaker over years. Typing on a phone is slow, every new food needs a row in Foods, and a repeated day means copying rows. If those costs start to decide whether you log, switch to a tool that takes a line of text.
Sources
- Rice, white, long-grain, regular, enriched, cooked (SR Legacy, FDC ID 168878), USDA FoodData Central
- XLOOKUP - Google Docs Editors Help, Google
- Chicken, broiler or fryers, breast, skinless, boneless, meat only, cooked, braised (Foundation, FDC ID 331960), USDA FoodData Central
- Eggs, Grade A, Large, egg whole (Foundation, FDC ID 748967), USDA FoodData Central
- Bananas, ripe and slightly ripe, raw (Foundation, FDC ID 1105314), USDA FoodData Central
- Oats, whole grain, rolled, old fashioned (Foundation, FDC ID 2346396), USDA FoodData Central
- Yogurt, Greek, plain, nonfat (Foundation, FDC ID 330137), USDA FoodData Central
- Milk, reduced fat, fluid, 2% milkfat, with added vitamin A and vitamin D (SR Legacy, FDC ID 171267), USDA FoodData Central
- Bread, wheat (SR Legacy, FDC ID 172686), USDA FoodData Central
- Broccoli, raw (Foundation, FDC ID 321900), USDA FoodData Central
- Oil, olive, salad or cooking (SR Legacy, FDC ID 171413), USDA FoodData Central
- Name a range of cells - Google Docs Editors Help, Google
- Add a drop-down list to a cell - Google Docs Editors Help, Google
- SUMIFS - Google Docs Editors Help, Google
- Rice, white, long-grain, regular, raw, enriched (SR Legacy, FDC ID 168877), USDA FoodData Central