Food Tracker Template for Calories and Macros
A food tracker template needs a row per food with grams, calories, protein, carbs and fat, plus total, target and left rows. Check the sums with 4 kcal per gram of protein and carbs and 9 per gram of fat.
Key takeaways
- A food tracker template has one row per food (grams, kcal, protein, carbs, fat) and three summary rows: total, target and left.
- Multiply a food's per-100 g values by your grams and divide by 100: 150 g of braised chicken breast is 48.2 g protein and 249 kcal.
- A hand check with 4 kcal per gram of protein and carbs and 9 per gram of fat landed 18 kcal (0.9%) above the 1,875 kcal total of a sample day.
- The US adult macronutrient ranges are 10–35% protein, 45–65% carbs and 20–35% fat, which at a 2,000 kcal reference are 50–175 g, 225–325 g and 44–78 g.
- The 2025–2030 US guidelines set protein at 1.2–1.6 g per kg of body weight, which is 90–120 g at 75 kg.
A food tracker template for calories and macros needs one row per food with five numbers: grams, calories, protein, carbs and fat. Three rows at the bottom hold the total, the target and what’s left. Copy the layout below. To check your arithmetic, multiply grams of protein and carbs by 4 and grams of fat by 9. Those are the Atwater factors, and the result should land close to your calorie total.
What columns does a food tracker template need?
Seven columns and three summary rows. Meal groups the day, Food names the entry, and Grams is whatever the scale says. The last four columns are the row’s numbers. A meal tracker template is this same layout with the Meal column made more prominent than the rest. A daily food log template is one sheet of it per day.
Here is the sheet. Add rows as the day needs them.
Date: ______
| Meal | Food | Grams | kcal | Protein (g) | Carbs (g) | Fat (g) |
|---|---|---|---|---|---|---|
| Total | ||||||
| Target | ||||||
| Left |
Total is the sum of each column. Left is Target minus Total. In a spreadsheet that is two formulas per column. With the six blank rows above, the total in the kcal column is =SUM(D2:D7) and what’s left is =D9-D8. Both fill across to the other columns. Insert new rows between existing ones so the range grows with the table. If you want the sheet to turn grams into calories for you, the calorie tracker spreadsheet does it with one lookup.
Paper works too. Paste the table into a document and print it, or use the plainer food diary template if you only want to write down what you ate. Either way, read the Left row first. It tells you what is still open while you’re deciding on dinner.
How do I fill in calories, protein, carbs and fat for a food?
Take the per-100 g values from the label or a food record such as this chicken entry, multiply by your grams, and divide by 100.
Chicken is a clean example. USDA’s record for braised chicken breast gives 32.1 g protein, 3.24 g fat and no carbohydrate per 100 g. For a 150 g portion that is 48.2 g protein, 4.9 g fat and 0 g carbs. The record lists 166 kcal per 100 g by specific Atwater factors, so the calories are 166 × 150 ÷ 100 = 249 kcal.
Now the check. Four times 48.2 plus nine times 4.9 comes to 237 kcal, not 249. The record explains the gap. It lists a second figure, 158 kcal per 100 g, by the general factors, and 158 × 150 ÷ 100 is 237. The 4-4-9 rule reproduces the general number, while the specific factors give a bit more for chicken. Both are legitimate, so pick one source for energy and keep to it. I use the specific figure when a record has one. Different picks like this are also why calorie trackers disagree about the same food.
Two smaller things widen the gap. FAO notes that in the Atwater system carbohydrate is determined by difference, so it includes fiber. And every row is rounded. Over a full day the effects stay small, as the sample below shows.
Avoid mixing sources inside one row, such as calories from a label and protein from a database. The row stops adding up, and you won’t know which number is off. Take all four numbers from the same place.
What does a filled-in food tracker template look like?
Like the table below. This is a sample day for the layout, not a target, built from USDA records. Each cell is the record’s value per 100 g times the grams, rounded to a whole kcal or one decimal place.
| Meal | Food, energy per 100 g | Grams | kcal | Protein (g) | Carbs (g) | Fat (g) |
|---|---|---|---|---|---|---|
| Breakfast | Eggs, large, whole, 147 kcal/100 g | 100.6 g | 148 | 12.5 | 1.0 | 10.0 |
| Breakfast | Wheat bread, 3 slices, 274 kcal/100 g | 87 g | 238 | 9.3 | 41.4 | 3.9 |
| Breakfast | Peanut butter, smooth, 597 kcal/100 g | 16 g | 96 | 3.6 | 3.6 | 8.2 |
| Breakfast | Milk, 2%, 50 kcal/100 g | 244 g | 122 | 8.1 | 11.7 | 4.8 |
| Lunch | Greek yogurt, nonfat, 61 kcal/100 g | 156 g | 95 | 16.1 | 5.7 | 0.6 |
| Lunch | Banana, 88 kcal/100 g | 115 g | 101 | 0.9 | 26.5 | 0.3 |
| Lunch | Almonds, raw, 584 kcal/100 g | 28 g | 163 | 6.0 | 5.6 | 14.3 |
| Afternoon | Orange, 47 kcal/100 g | 140 g | 66 | 1.3 | 16.5 | 0.2 |
| Dinner | Chicken breast, braised, 166 kcal/100 g | 150 g | 249 | 48.2 | 0.0 | 4.9 |
| Dinner | White rice, cooked, 130 kcal/100 g | 330 g | 429 | 8.9 | 93.0 | 0.9 |
| Dinner | Broccoli, raw, 32 kcal/100 g | 152 g | 49 | 3.9 | 9.6 | 0.5 |
| Dinner | Olive oil, 884 kcal/100 g | 13.5 g | 119 | 0.0 | 0.0 | 13.5 |
| Total | 1,875 | 118.8 | 214.6 | 62.1 | ||
| Check | 4 × protein + 4 × carbs + 9 × fat | 1,893 |
The columns add up to 1,875 kcal, 118.8 g protein, 214.6 g carbs and 62.1 g fat. The check row comes to 1,893 kcal, which is 18 kcal or 0.9% higher than the total. Chicken and rice come out below their records, while banana, almonds, broccoli and orange come out above, and the net is 18 kcal. A gap this small is normal, because the 4-4-9 factors are averages and each record rounds its own values. A typing slip shows up as a much bigger gap: a rice weight entered as 33 g instead of 330 g would pull the total about 390 kcal below the check.
Now the shares. Protein supplies 4 × 118.8 = 475 kcal, carbs 858 kcal and fat 559 kcal, which is 25%, 45% and 30% of the macro calories. The US adult ranges in the 2020–2025 Dietary Guidelines are 10–35% protein, 45–65% carbs and 20–35% fat. This day sits inside all three, though I tuned the rice to make it so. A real day can land outside one. In my sheet that is a note, not a mark against the day. When I read a sheet like this, I look at protein first, because it is the one macro whose target scales with body weight, and I check the rest only if something looks odd.
How do I set the target and left rows?
Fill in both from a source. For calories, get your own number from the calorie calculator, which uses the NASEM 2023 equations and keeps the result above a safe minimum. For protein, the 2025–2030 Dietary Guidelines give a goal of 1.2–1.6 g per kg of body weight a day, adjusted to your calorie needs. At 75 kg that is 90–120 g, and the sample day’s 118.8 g falls inside it.
Fat and carbs can come from the same ranges. The Guidelines also use a 2,000-calorie pattern as a reference, so here is what the percentages mean in grams at that level. This is a conversion table, not a recommendation to eat 2,000 kcal.
| Share of a 2,000 kcal day | Range | Calculation | Grams |
|---|---|---|---|
| Protein | 10–35% | 200–700 kcal ÷ 4 kcal/g | 50–175 g |
| Carbs | 45–65% | 900–1,300 kcal ÷ 4 kcal/g | 225–325 g |
| Fat | 20–35% | 400–700 kcal ÷ 9 kcal/g | 44–78 g |
The ranges are wide. If you want a macro split worked out for your own calories, the macro calculator does the arithmetic. If a doctor or dietitian has given you targets, put theirs in the Target row instead.
Use the Left row as information. At 4 pm it tells you how much room is left for dinner, in kcal and in protein. A negative number is just a figure for the day, and tomorrow starts blank.
How do I keep the sheet from taking over my day?
Fill it in once at each meal and total it once a day. Weigh the foods that move the numbers, such as rice, oil and nuts, and write the rest as a measure. In the sample day, the rice and the oil are 548 of 1,875 kcal.
A weekly page keeps the daily ones honest. Copy each day’s totals into a seven-row table and add an average at the bottom. If a GP or dietitian asked for the week, their own form or a 7-day food diary fits that job better than this sheet.
| Day | kcal | Protein (g) |
|---|---|---|
| Mon | ||
| Tue | ||
| Wed | ||
| Thu | ||
| Fri | ||
| Sat | ||
| Sun | ||
| Average |
One heavy day barely moves the average, so judge the week and skip the single Tuesday.
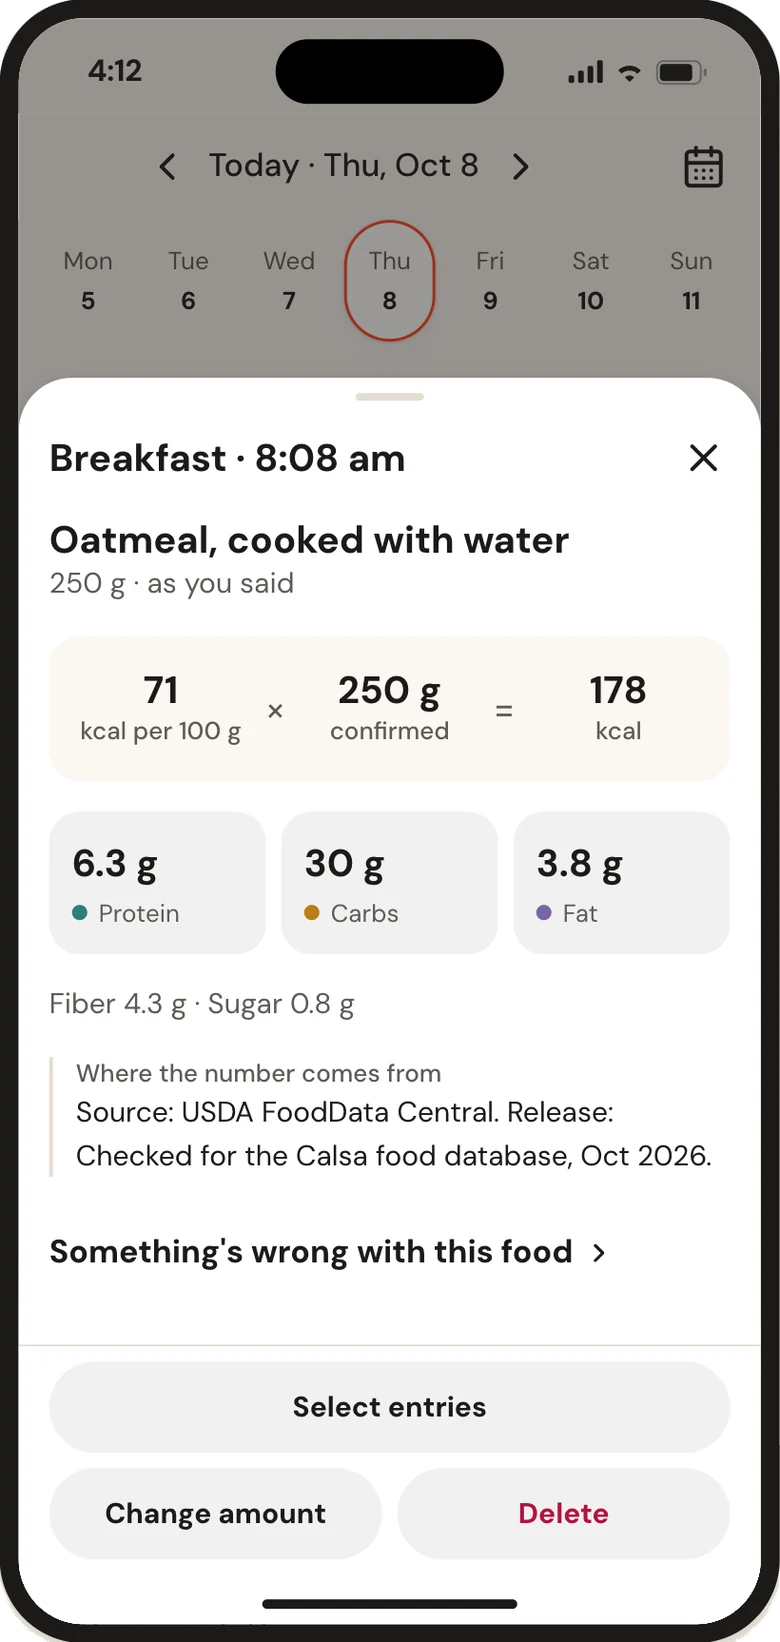
To avoid building columns yourself, Calsa shows calories, protein, fat and carbs with each entry. It also splits your day by meal and updates what’s left after every entry.
Questions and answers
What should a food tracker template include?
One row per food with grams, calories, protein, carbs and fat, plus total, target and left rows at the bottom. Keep a Meal column if you want the day grouped. Everything else, such as notes or mood, is optional.
How do I calculate macros for a food log?
Take the per-100 g protein, carbs and fat from the label or a food record, multiply by your grams and divide by 100. For 150 g of braised chicken breast with 32.1 g protein per 100 g, that is 48.2 g. Take all four numbers for a row from the same source.
Why don't my macros add up to my calories?
The usual cause is the energy factors. Four kcal per gram of protein and carbs and 9 per gram of fat give 237 kcal for 150 g of braised chicken breast, while the USDA record's specific factors give 249 kcal. Rounding and fiber counted inside carbs add small differences.
Is a daily food log template different from a food tracker template?
Not much. A daily food log template is one sheet per day, and a food tracker template adds the numbers and summary rows to it. Use the layout with only the Food and Grams columns if you want the lighter version.
How many grams of protein, carbs and fat is that in a day?
At a 2,000 kcal reference, the US adult macronutrient ranges convert to 50–175 g of protein, 225–325 g of carbs and 44–78 g of fat. I read them as a guide to usual eating, so one day outside them is a note, not a problem.
Sources
- Food energy: methods of analysis and conversion factors. Chapter 3: Calculation of the energy content of foods (FAO Food and Nutrition Paper 77), Food and Agriculture Organization of the United Nations
- Chicken, broiler or fryers, breast, skinless, boneless, meat only, cooked, braised (Foundation, FDC ID 331960), USDA FoodData Central
- Eggs, Grade A, Large, egg whole (Foundation, FDC ID 748967), USDA FoodData Central
- Bread, wheat (SR Legacy, FDC ID 172686), USDA FoodData Central
- Peanut butter, smooth style, with salt (Foundation, FDC ID 324860), USDA FoodData Central
- Milk, reduced fat, fluid, 2% milkfat, with added vitamin A and vitamin D (SR Legacy, FDC ID 171267), USDA FoodData Central
- Yogurt, Greek, plain, nonfat (Foundation, FDC ID 330137), USDA FoodData Central
- Bananas, ripe and slightly ripe, raw (Foundation, FDC ID 1105314), USDA FoodData Central
- Nuts, almonds, whole, raw (Foundation, FDC ID 2346393), USDA FoodData Central
- Oranges, raw, navels (Foundation, FDC ID 746771), USDA FoodData Central
- Rice, white, long-grain, regular, enriched, cooked (SR Legacy, FDC ID 168878), USDA FoodData Central
- Broccoli, raw (Foundation, FDC ID 321900), USDA FoodData Central
- Oil, olive, salad or cooking (SR Legacy, FDC ID 171413), USDA FoodData Central
- Dietary Guidelines for Americans, 2020-2025 (Appendix 1, Table A1-2: Daily Nutritional Goals, Ages 2 and Older), U.S. Department of Agriculture and U.S. Department of Health and Human Services
- Dietary Guidelines for Americans, 2025–2030, U.S. Department of Health and Human Services and U.S. Department of Agriculture